Stock Market Lull Before the Storm?
Stock-Markets / Stock Markets 2012 Apr 16, 2012 - 12:28 PM GMTBy: Mike_Paulenoff
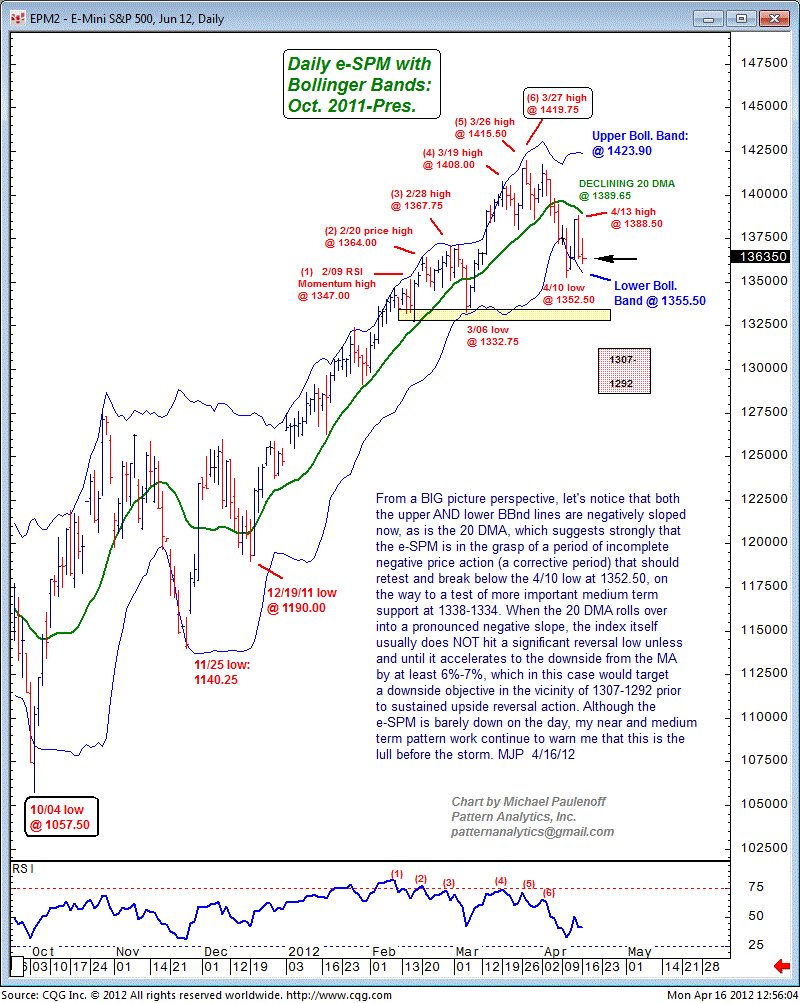
From a big picture perspective, let's notice that both the upper and lower Bollinger Band lines are negatively sloped now, as is the 20-day moving average. This suggests strongly that the e-mini S&P 500 is in the grasp of a period of incomplete negative price action (a corrective period) that should retest and break below the April 10 low at 1352.50, on the way to a test of more important medium term support at 1338-1334.
When the 20 DMA rolls over into a pronounced negative slope, the index itself usually does not hit a significant reversal low unless and until it accelerates to the downside from the moving average by at least 6%-7%. In this case it would target a downside objective in the vicinity of 1307-1292 prior to sustained upside reversal action.
Although the e-SPM is barely down on the day, my near- and medium-term pattern work continue to warn me that this is the lull before the storm.

Sign up for a free 15-day trial to Mike's ETF & Stock Trading Diary today.
By Mike Paulenoff
Mike Paulenoff is author of MPTrader.com (www.mptrader.com), a real-time diary of his technical analysis and trading alerts on ETFs covering metals, energy, equity indices, currencies, Treasuries, and specific industries and international regions.
© 2002-2012 MPTrader.com, an AdviceTrade publication. All rights reserved. Any publication, distribution, retransmission or reproduction of information or data contained on this Web site without written consent from MPTrader is prohibited. See our disclaimer.
Mike Paulenoff Archive |
© 2005-2022 http://www.MarketOracle.co.uk - The Market Oracle is a FREE Daily Financial Markets Analysis & Forecasting online publication.


