7 Large-cap Industrial Stocks with High Growth Rates, Low Valuations and Above-average Dividend Yields
Companies / Investing 2012 Apr 16, 2012 - 10:21 AM GMTBy: Fast_Graphs
 This article screened the industrial sector searching for companies that offer above-average forecast earnings growth of 15% to 20% or better that could be purchased at an attractive valuation. Although each of these companies pays a dividend, due to the cyclical nature of this industry we encourage the reader to carefully review the dividend history on each individual company.
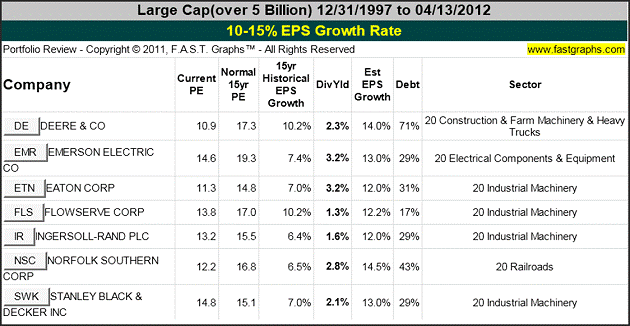
The following table summarizes seven large-cap Industrials that appear to be attractively valued, and lists them in order of Estimated EPS Growth order. From left to right, the table shows the company’s stock symbol and name. Next, two valuation metrics are listed side-by-side, the current PE ratio followed by the historical normal PE ratio for perspective. The final four columns show the current dividend yield, estimated EPS Growth, debt and company sector.
Chart 1
A Closer Look at the Past and the Future Potential
Since a picture is worth 1,000 words, we’ll take a closer look at the past performance and future potential of each of our five candidates through the lens of F.A.S.T. Graphs™.
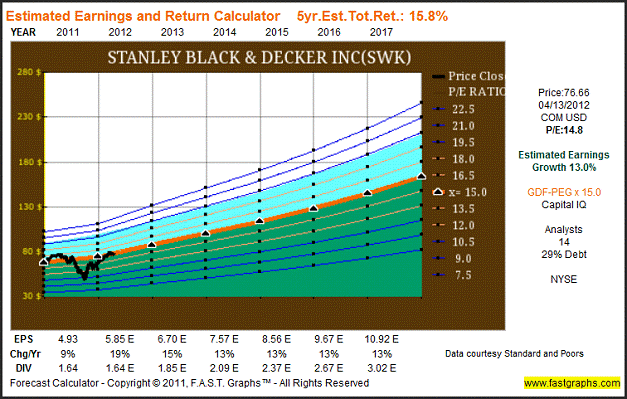
Earnings Determine Market Price: The following earnings and price correlated historical graphs clearly illustrates the importance of earnings. The Earnings Growth Rate Line or True Worth™ Line (orange line with white triangles) is correlated with the historical stock price line. On graph after graph the lines will move in tandem. If the stock price strays away from the earnings line (over or under), inevitably it will come back to earnings. The historical normal PE ratio line (dark blue line with*) depicts a PE ratio that the market has historically applied.
The orange True Worth™ line and the blue normal PE ratio line provide perspectives on valuation. The orange line reflects the fair value of each company’s earnings relative to its growth rate achievement, and the blue line reflects how the market has traditionally valued the company’s stock relative to its fair value. The blue line represents a trimmed historical normal PE ratio (the highest and lowest PEs are trimmed). These lines should be viewed as barometers or aids for ascertaining sound buy, sell or hold decisions. Rather than seen as absolutes, they should be seen as guides to better thinking.
About Deere & Co (DE): Directly from their website
“Deere & Company (NYSE: DE) is a world leader in providing advanced products and services and is committed to the success of customers whose work is linked to the land - those who cultivate, harvest, transform, enrich and build upon the land to meet the world's dramatically increasing need for food, fuel, shelter and infrastructure. Since 1837, John Deere has delivered innovative products of superior quality built on a tradition of integrity.”
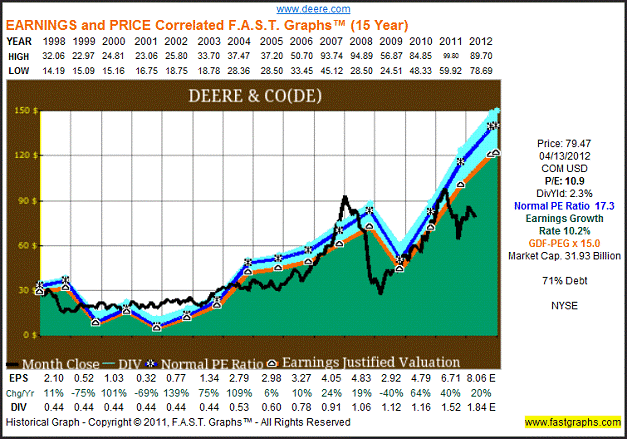
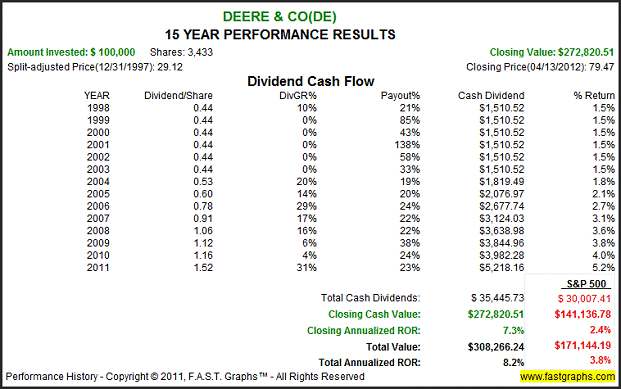
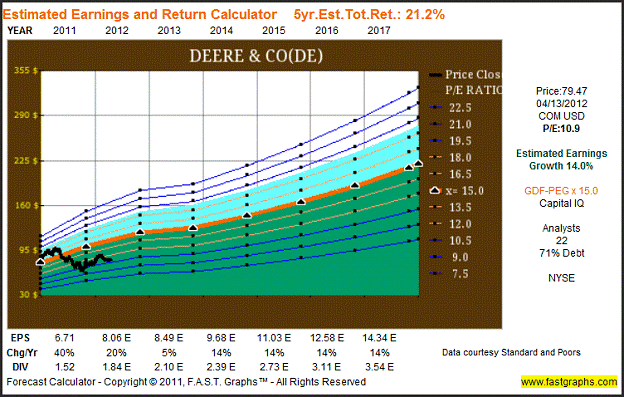
The consensus of 22 leading analysts reporting to Capital IQ forecast Deere & Co’s long-term earnings growth at 14%. Deere & Co has high long-term debt at 71% of capital. Deere & Co is currently trading at a P/E of 10.9, which is below the value corridor (defined by the five orange lines) of a maximum P/E of 18. If the earnings materialize as forecast, Deere & Co’s True Worth™ valuation would be $215.09 at the end of 2017, which would be a 21.2% annual rate of return from the current price.
About Emerson Electric Co (EMR): Directly from their website
“Emerson (NYSE: EMR), based in St. Louis, Missouri (USA), is a global leader in bringing technology and engineering together to provide innovative solutions for customers in industrial, commercial, and consumer markets around the world. The company is comprised of five business segments: Process Management, Industrial Automation, Network Power, Climate Technologies, and Commercial & Residential Solutions. Sales in fiscal 2011 were $24.2 billion.”
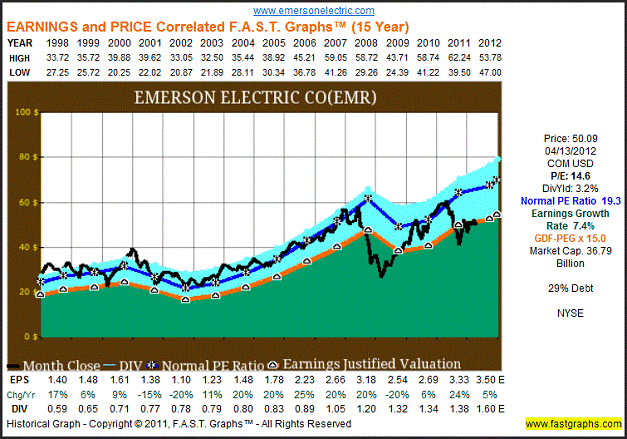
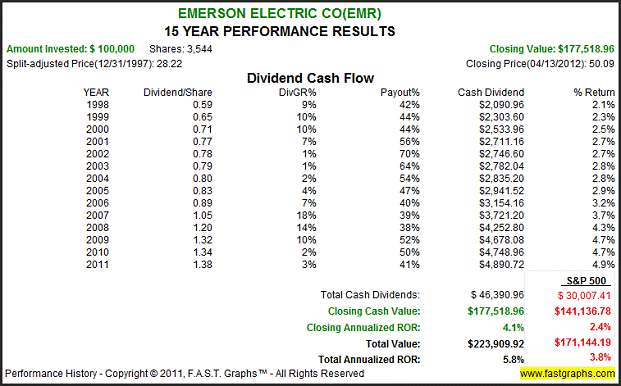
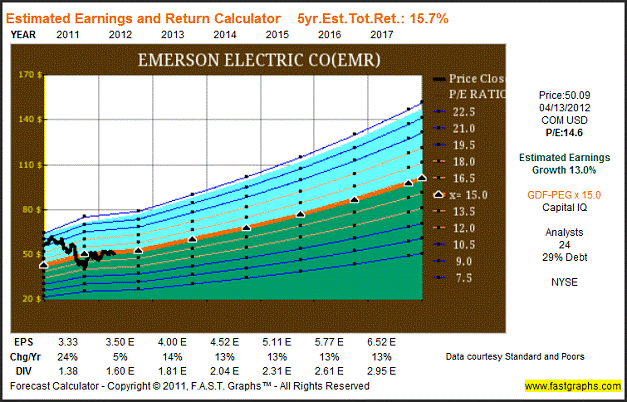
The consensus of 24 leading analysts reporting to Capital IQ forecast Emerson Electric Co’s long-term earnings growth at 13%. Emerson Electric Co has medium long-term debt at 29% of capital. Emerson Electric Co is currently trading at a P/E of 14.6, which is inside the value corridor (defined by the five orange lines) of a maximum P/E of 18. If the earnings materialize as forecast, Emerson Electric Co’s True Worth™ valuation would be $97.83 at the end of 2017, which would be a 15.7% annual rate of return from the current price.
About Eaton Corp (ETN): Directly from their website
“Eaton Corporation is a diversified power management company with more than 100 years of experience providing energy-efficient solutions that help our customers effectively manage electrical, hydraulic and mechanical power. With 2011 sales of $16.0 billion, Eaton is a global technology leader in electrical components and systems for power quality, distribution and control; hydraulics components, systems and services for industrial and mobile equipment; aerospace fuel, hydraulics and pneumatic systems for commercial and military use; and truck and automotive drivetrain and powertrain systems for performance, fuel economy and safety. Eaton has approximately 73,000 employees and sells products to customers in more than 150 countries.”
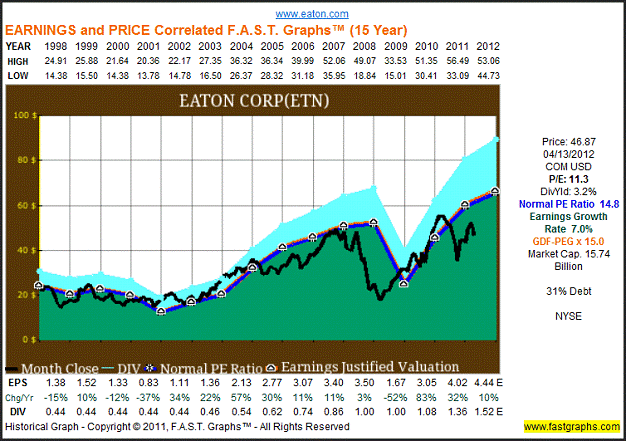
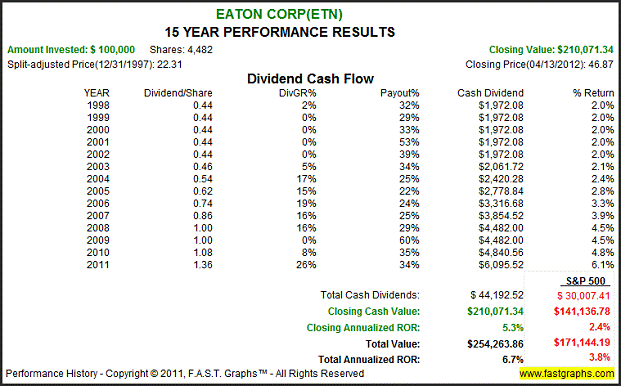
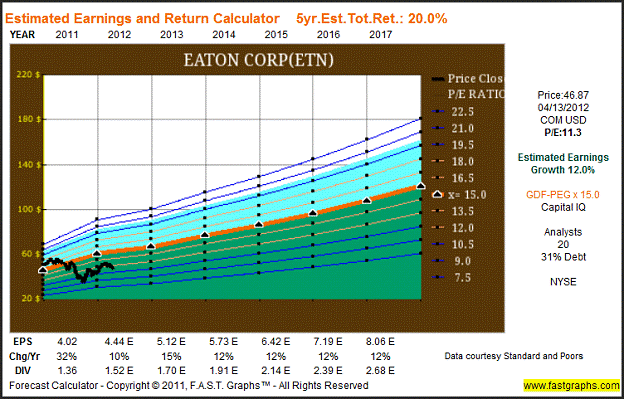
The consensus of 20 leading analysts reporting to Capital IQ forecast Eaton Corp’s long-term earnings growth at 12%. Eaton Corp has medium long-term debt at 31% of capital. Eaton Corp is currently trading at a P/E of 11.3, which is below the value corridor (defined by the five orange lines) of a maximum P/E of 18. If the earnings materialize as forecast, Eaton Corp’s True Worth™ valuation would be $120.85 at the end of 2017, which would be a 20% annual rate of return from the current price.
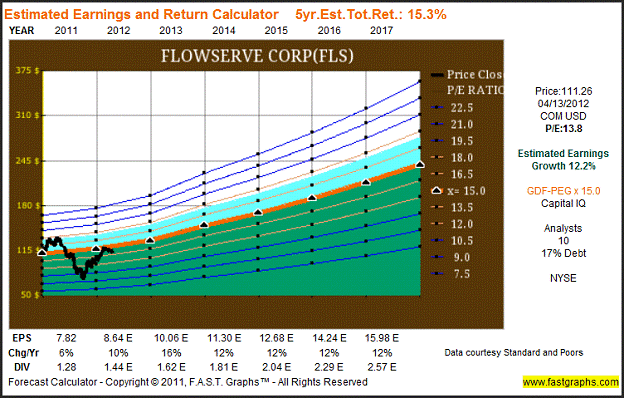
About Flowserve Corp (FLS): Directly from their website
“Flowserve Corp. is one of the world's leading providers of fluid motion and control products and services. Operating in more than 55 countries, the company produces engineered and industrial pumps, seals and valves as well as a range of related flow management services.”
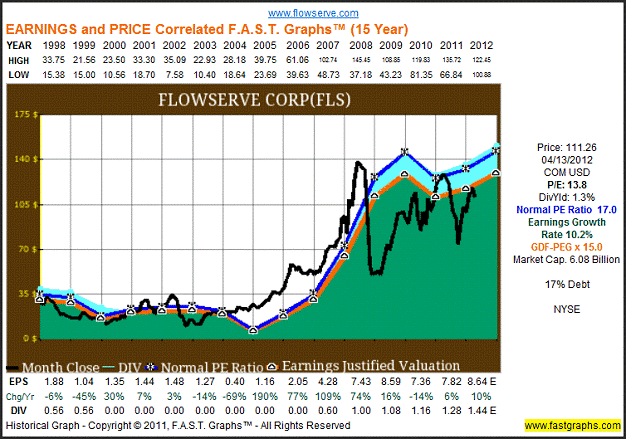
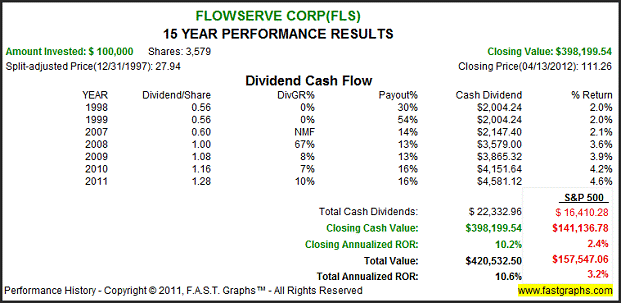
The consensus of 10 leading analysts reporting to Capital IQ forecast Flowserve Corp’s long-term earnings growth at 15.3%. Flowserve Corp has low long-term debt at 17% of capital. Flowserve Corp is currently trading at a P/E of 13.8, which is inside the value corridor (defined by the five orange lines) of a maximum P/E of 18. If the earnings materialize as forecast, Flowserve Corp’s True Worth™ valuation would be $239.69 at the end of 2017, which would be a 15.3% annual rate of return from the current price.
About Ingersoll-Rand (IR): Directly from their website
“Ingersoll Rand (NYSE:IR) advances the quality of life by creating and sustaining safe, comfortable and efficient environments. Our people and our family of brands—including Club Car®, Ingersoll Rand®, Schlage®, Thermo King® and Trane® —work together to enhance the quality and comfort of air in homes and buildings; transport and protect food and perishables; secure homes and commercial properties; and increase industrial productivity and efficiency. We are a $14 billion global business committed to a world of sustainable progress and enduring results.”
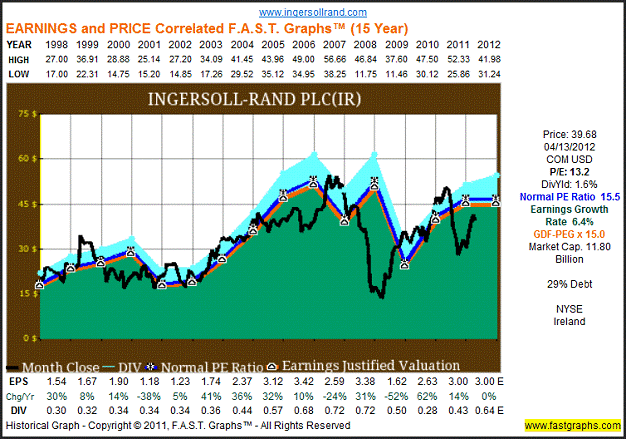
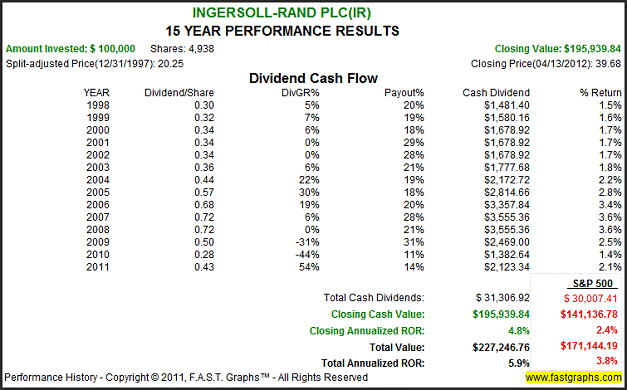
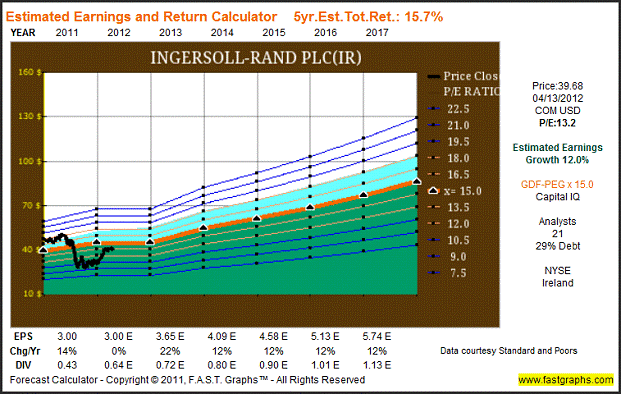
The consensus of 21 leading analysts reporting to Capital IQ forecast Ingersoll-Rand’s long-term earnings growth at 12%. Ingersoll-Rand has medium long-term debt at 29% of capital. Ingersoll-Rand is currently trading at a P/E of 13.2, which is inside the value corridor (defined by the five orange lines) of a maximum P/E of 18. If the earnings materialize as forecast, Ingersoll-Rand’s True Worth™ valuation would be $86.15 at the end of 2017, which would be a 15.7% annual rate of return from the current price.
About Norfolk Southern Corp (NSC): Directly from their website
“Norfolk Southern Corporation is one of the nation’s premier transportation companies. Its Norfolk Southern Railway subsidiary operates approximately 20,000 route miles in 22 states and the District of Columbia, serves every major container port in the eastern United States, and provides efficient connections to other rail carriers. Norfolk Southern operates the most extensive intermodal network in the East and is a major transporter of coal and industrial products.”
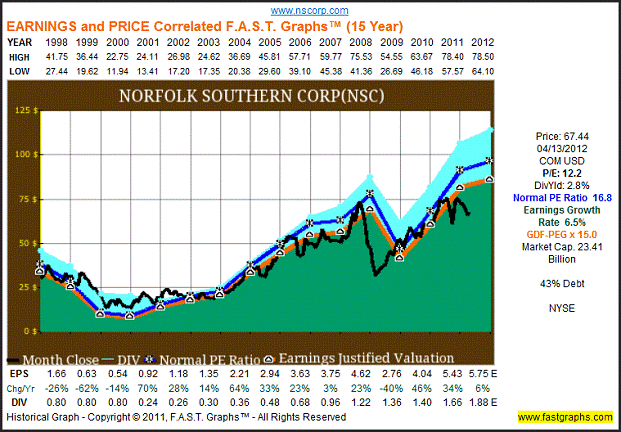
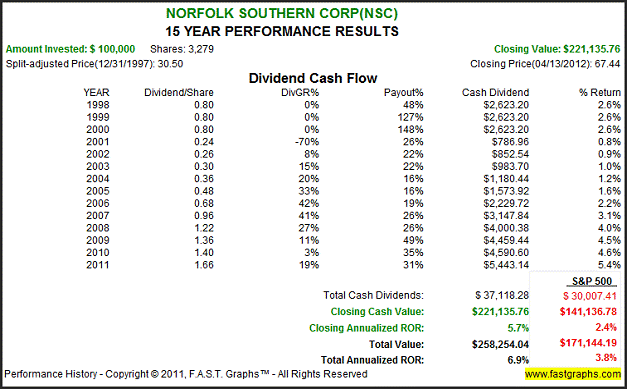
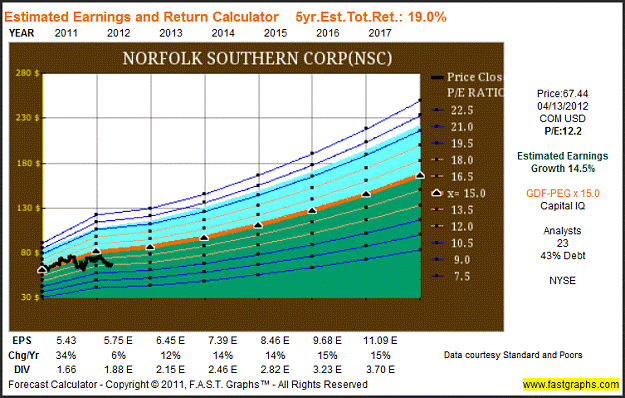
The consensus of 23 leading analysts reporting to Capital IQ forecast Norfolk Southern Corp’s long-term earnings growth at 14.5%. Norfolk Southern Corp has medium long-term debt at 43% of capital. Norfolk Southern Corp is currently trading at a P/E of 12.2, which is inside the value corridor (defined by the five orange lines) of a maximum P/E of 18. If the earnings materialize as forecast, Norfolk Southern Corp’s True Worth™ valuation would be $166.29 at the end of 2017, which would be a 19% annual rate of return from the current price.
About Stanley Black & Decker Inc (SWK): Directly from their website
“Stanley Black & Decker, an S&P 500 company, is a diversified global provider of hand tools, power tools and related accessories, mechanical access solutions and electronic security solutions, engineered fastening systems, and more.”
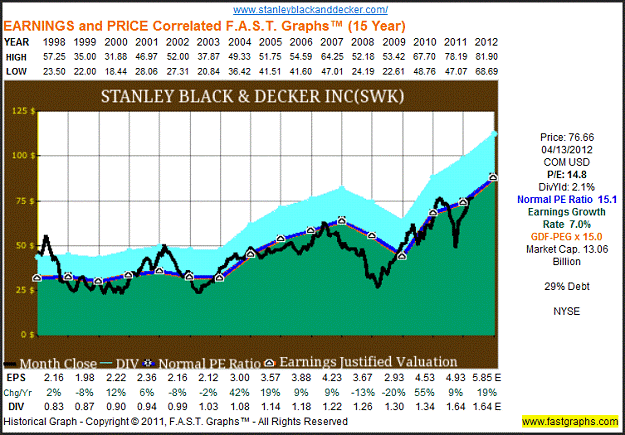
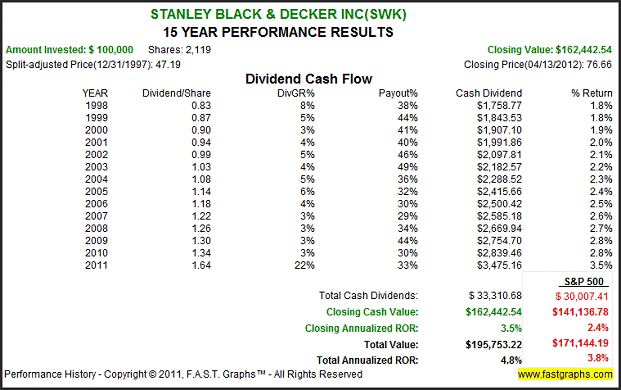
The consensus of 14 leading analysts reporting to Capital IQ forecast Stanley Black & Decker Inc’s long-term earnings growth at 13%. Stanley Black & Decker Inc has medium long-term debt at 29% of capital. Stanley Black & Decker Inc is currently trading at a P/E of 14.8, which is inside the value corridor (defined by the five orange lines) of a maximum P/E of 18. If the earnings materialize as forecast, Stanley Black & Decker Inc’s True Worth™ valuation would be $163.86 at the end of 2017, which would be a 15.8% annual rate of return from the current price.
Summary and Conclusions
The industrial sector can be thought of as a semi-cyclical industry. However, when companies are coming out of trough earnings, they can often generate significant growth for several years. The companies listed in this article are forecast to grow at above-average rates for the foreseeable future. More importantly, based on those forecasts, they appear to be trading at price earnings ratios that are lower than the estimated growth rate. Consequently, if they achieve the growth rates as expected, they will represent an excellent opportunity at least for the intermediate term.
Disclosure: Long SWK at the time of writing.
By Fast Graphs
Disclaimer: The opinions in this document are for informational and educational purposes only and should not be construed as a recommendation to buy or sell the stocks mentioned or to solicit transactions or clients. Past performance of the companies discussed may not continue and the companies may not achieve the earnings growth as predicted. The information in this document is believed to be accurate, but under no circumstances should a person act upon the information contained within. We do not recommend that anyone act upon any investment information without first consulting an investment advisor as to the suitability of such investments for his specific situation.
© 2005-2022 http://www.MarketOracle.co.uk - The Market Oracle is a FREE Daily Financial Markets Analysis & Forecasting online publication.


