


The Magical Decline Of Crude Oil Demand
Commodities / Crude Oil Apr 15, 2012 - 12:25 PM GMTBy: Andrew_McKillop

 People who like conspiracy theory are well served by the Oil Establishment's ceaseless quest to present world oil supply as sufficient if not 'abundant', denying the evidence of Peak Oil, and accessorily keeping a lid on oil prices. BP, like most of the downsized family of private, nonOPEC, non Emerging country national oil companies, and the energy agencies of the major oil consuming countries spins magical theories purporting to show that oil demand is "withering away". The clan of oil majors once called the Seven Sisters, but today better called the 5 Anxious Dwarfs in oil production terms because all of them are making the Gas Shift away from oil, claims that global oil demand "will shrink to nothing". To be sure, the 5 Dwarfs now control only 12% of world oil production capacity, even if their profits remain impressive, so they like to pretend they dont need Black Stuff anymore.
Like other Anxious Dwarfs, BP massages the numbers to show that world oil supply is holding up, while oil demand is naturally fading away, preparing the mega shift away from oil to gas, and making it 'unlikely' oil prices can hit the peaks of 2008.
We could ask, firstly, why would a major oil producer want cheap oil ? BP's annual reports, showing which divisions grapple most EBITDA clearly indicates that producing crude tends to earn less and less, with big exceptions as in year 2007 through about June 2008, and again from late 2010, while 'downstream value-added' activity, starting with oil refining and products marketing can earn much more. The balancing act is however fragile: oil demand has to stay high enough to keep prices up - but prices must not go off the top of the graph as in 2008, and as they threaten again now. This balancing act therefore also needs accessories, like the theory that Peak Oil theory is a myth !
BOLSTERING THE THEORY
On the supply side, oil consumer nation agencies such as the OECD’s IEA and the US EIA, sometimes joined by OPEC's secretariat, by Russian oil sector forecasting institutions (for the same and different reasons), and by all the now mostly disappeared 'market maker' banks such as Bear Stearns, Merrill Lynch, Lehman Bros and alive and kicking Goldman Sachs and Citibank maintain there is a long-term trend to ‘structural oversupply of oil’. That is, world oil supply will always tend to increase faster than demand, at least until "far off" 2015 or 2017.
BP, in its report has its own 'killer app' which we can call its ‘Magic Curve’. This graph, on BP Web sites claims there is constant trend to falling rates of world oil demand growth: almost every year it gets lower, making it unnecessary to raise production - which would reduce oil prices ! Early Magic Curve versions (now disappeared from BP web sites) invited casual glancers to believe that complete zero growth of global oil demand would be attained about the year 2008. Present versions place the ZDG (zero demand growth) date a decent interval further out.
Since 2008, in what the IMF calls the worst-ever economic recession since 1945, global oil demand contracted a little then bounced back, through 2008-2011. This is an awful lot different from BP's claims that global oil demand will totally cease growing at a highly predictable date - whatever that date is. What happens after ZDG is reached does not appear on BP Web sites: will this be a symmetrical Peak Oil type downslope, or what ? Will the gas shift absorb the energy demand oil can't satisfy ?
What we know is a lot simpler: only deep recession cuts world oil demand as all Europe's PIIGS show.
If and when economic growth recovers, so will oil demand, for one reason because all and any alternate and renewable energy sources and systems are totally uneconomic with oil prices at even 50 USD/bbl, and related prices for natural gas and coal. Making this problem even more real, and more serious for the ex-Seven Sisters, now transforming to global gas majors, US shale gas has so depressed US gas prices that they are losing money on their US gas operations, for Exxon shaving its annual earnings in 2011 by around 8%. When or if oil prices also slipped, this would be a very uncomfortable place for them to occupy.
What the ex-oil majors, now gas majors need, is an organized and internationally-agreed oil price hike that also safeguards gas and coal prices, and alternate and renewable energy (ARE) investing - but does not crater the world economy, which is already in its own self-dug financial hole.
PETRO KEYNESIAN GROWTH
In the real world, as proven through 2004-2007, record global economic and trade growth levered up world oil demand and prices. Also, high oil prices always spill over to other commodity prices, and trigger the Petro Keynesian growth process. A repeat of 2005-2007 is possible if oil prices were held above 75 USD/bbl but did not peak out at prices near 150 USD/bbl. The 'comfort zone' for oil prices is very clear, it is cast in stone.
To be sure, BP's Magic Curve message excludes any talk of Petro Keynesian growth in the real economy, driven by higher oil prices, and creating further increases in oil demand. Repeated press statements by BP's Chief Economist, year after year, make it clear this lever to global economic growth is not treated as a part of the real world, exactly like BP's failure in 2008 to predict the gathering financial storm, and impacts on world oi from the worst global recession for 63 years.
Other processes were claimed to be in operation, by BP, which has signalled its loss of confidence in ARE through steadily quitting renewable energy ventures, for example its high-priced, low performing 'miracle biofuel' acquisitions such as D 1 Oils and its solar ventures. BP's economic fairy called Magic Curve goes on to embed several other myths. These avoid the fact that both on the supply side, and on the demand side - in the real world - any temporary ‘oversupply’ of the market will be precisely that, temporary. This inconvenient truth is always avoided.
Underlying BP's Magic Curve, we have petroleum’s answer to the Laffer Curve: it says price elastic demand response really exists ! Rising oil prices – which in early Summer 2008 tested 147 USD/barrel front month future contract prices for WTI on the US Nymex - were supposedly the driver for falling oil demand. In reality, not until the global bank sector and financial meltdown which traced back to the US subprime crisis of Summer 2007, did we get any strong and unambiguous 'price elastic' fall of world oil demand. The two events were juxtaposed, not cause-and-effect.
We can note here that the extreme crisis year of 2008 for world automobile makers, among others, had an outturn of about 70 million cars and light trucks below 2500 kgs weight (ignoring heavy trucks, buses, tractors, offroad vehicles and the rest). For 2012 global carmakers will likely produce 79.5 million cars and light trucks. One passenger car needs about 2.5 barrels of oil to produce, and on global average consumes about 9 barrels/year of oil to operate.
The net addition to global road fleets, after scrapping, likely runs at around 55 million new cars and light trucks each year. This alone generates about 1.25 Mbd of oil demand growth every year, making it necessary to find a lot of demand cuts and oil substitution, to get down to zero growth !
What we get is the most inconvenient of all truths: reverse elasticity or a real world trend of oil demand increasing as oil prices rise. This happened right through 2004-2008 at almost any price for oil – of course with 'vintage growth' rates for demand of cheaper natural gas, and even cheaper coal.
This was due to Petro Keynesian growth. In brief, the revenue effect for exporter countries with high marginal propensities to consume, called 'freespending' in regular journalistic language, is directly due to higher oil and energy prices. This also drags up prices and revenues for exporters of all the other commodities, allowing them to buy Chinese or Indian soft toys, shoes, PCs and electronic gadgets, and soon cars, just like 'mature consumers' in the so-called "postindustrial" OECD countries, wallowing in a permanent feast of industrial goods.
REAL WORLD - VERSUS KYOTO WORLD AND OTHER MYTHS
BP's classic-minded, OECD-bias economists didn’t want to recogize this real world fact, but the real economy supplies us incontrovertible evidence that higher revenues for the world’s many real resource exporters, due to higher oil and energy prices, completely swamps the price-elastic response to higher oil prices. This effect could or might affect the richworld OECD countries, using 5 to 15 times more oil per head of population than nonOECD countries, but the 86% of global population in the nonOECD world consume more oil whenever they can. Refusing this simple fact, the OECD-bias extends to the ongoing struggle between the real world, and myths like the Kyoto World.
Sometimes included as a supporting theme or meme, sometimes not, versions of BP's Magic Curve can include forecasts of long-term oil demand decline by Kyoto Treaty compliant countries (EU countries, Japan, Canada until end 2011, Australia, New Zealand). Here, the theory or myth runs that ARE development effort certainly includes oil savings, even if the real world action does not show this. Nearly all ARE are used to produce electricity - saving coal and gas, more than oil. Also like we know, since end 2011 and the presently fast-rising political storm clouds above the EU's emissions trading scheme (ETS), the game of fantasy cuts of national fossil energy burning in Europe, supposedly including oil in a fuzzy future to 2020, is falling apart. Europe uses less oil in recession, period.
Exactly the same European Commission which proposed its "climate-energy package" of end 2008, including a proposed 20% cut in total fossil energy consumption in EU countries by 2020, is also praying out loud that the European automobile industry can regain its vigor and strength, and crank out 14.5 million cars a year, like it did in the good times before 2008. What these real world cars run on is easy to say, but schizophrenia reins !
Ignoring the reality that the right price signals for Energy Transition include high and stable oil and energy prices, the schizoid thinking extends to believing car sales can rise faster if oil prices fall and stay low but below about USD 75 a barrel, perhaps more than that, the global economic Petro Keynesian upturn is a dead duck. One direct measure of this happening is simple: global car sales will decline when or if oil prices crash.
Also totally excluded from fairy tale economics of the BP Magic Curve type, real world demographic and energy economic facts and trends make for almost unlimited oil, gas, coal and uranium demand growth. This is reality but if it is a problem, it has first to be admitted as reality and 40 years of hard-edged real world numbers have to be denied.
World population has increased about 3500 million since 1969, that is doubled. This driver for increased energy demand is hard to put on the back burner and pretend it does not exist. Taking a short cut, we can note that world oil demand at the current US per capita average consumption rate of about 22 barrels/capita/year (bcy), which has only slightly fallen since 2007, would explode global demand to around 445 Mbd.
Nobody sane, anywhere, says this production or supply could be possible. Facing up to reality means accepting facts, first. Even using the OECD-wide average of around 15 bcy in 2011, we get a "Not Possible"readout for global oil demand, of way above 225 Mbd.
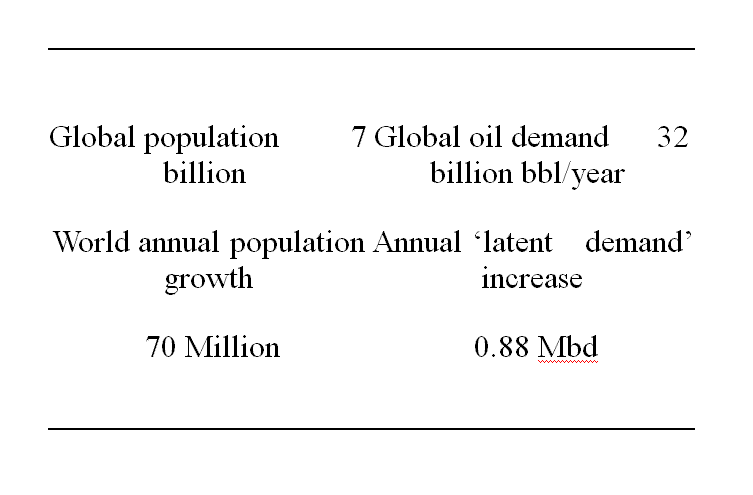
Worldwide, today's real global average oil demand is about 4.6 bcy. We can note that world population growth although declining, brings along plenty of new oil consumers, each and every year. World annual demographic growth at about 70 million-a-year produces this, below, if we assumed there is zero economic growth as well as no technology change:
GETTING TO ZDG
Any projection of low – or even zero - growth of world oil demand, as in BP's Magic Curve but in a context of no recession must assume massive commitments to energy transition away from fossil fuels in all the OECD countries and/or dramatically slower global economic growth. About the only other alternative is a completey hypothetical ‘alternate model’ for economic growth, especially in the Asian and other Emerging Economies. It would demand a de-industrialising strategy world wide, even for the presently fast-industrialising countries!
In other words a Global Ecology transition, back to the bicycle, village living and vegetarian biofood diets – which is already a fading advertising and publicity pitch for new industrial products, called green and clean.
At the current time there is no sign that either of these Nice Theory solutions coming about in the real world, unless we try the conspiracy theory that the OECD group, led by the US, Europe and Japan voluntarily sabotaged their economies in 2008 - to save oil !
Annual growth of oil demand by China, India, Bangladesh, Pakistan, Brazil, Turkey and other nonOECD, large population, oil importing industrialising countries could hit as much as 1.75 Mbd each year, under 2004-2007 global economic conditions. Not even 2 years of that growth would send oil prices right off the top of the graph. Even with continued slow oil demand growth by the OECD group, or recession-driven decline of their demand, and in no way related to the Kyoto sideshow, global oil demand can easily bounce.
NO POINT TRYING
There is little need listing the reasons why the world’s increasingly fragile, slow growing world oil supply structure and system is faced by a world oil demand context that is radically different from the wishful thinking underlying the BP Magic Curve.
We can simply note that dependable Peak Oil denial from playful flyweights like Dan Yergin or oil industry stalwarts like former CEO Lee Raymond and E&P chief Jon Thompson of ExxonMobil, or Christophe de Margerie of Total has problems staying on track. The real bottom line on global oil production is increasingly heard: world oil output will very likely never achieve more than around 90 Mbd on a short-life basis, before terminal decline sets into operation. The only upside is that necessarily more expensive shale oil, and necessarily expensive GTL (oil from gas) may smooth the downslope.
Today's IEA forecast for global average daily demand in 2012 is about 89.9 Mbd.
Structural undersupply rather than oversupply shows up anytime major regional conflicts heat up in the Middle East or in Africa's increasing number of oil exporter countries.
To what extent this will lead to oil being taken outside the market pricing system, is a question which now needs serious answers. If the world's political leaderships can rush to the aid of failed investment banks and failing high street banks and insurers, they can also do this to avert an endgame with oil way above USD 150 per barrel. The response needed is organized big spending on alternate energy on a long-term basis - not played across the casino tables of the finance industry, as just one more betting chip.
By Andrew McKillop
Contact: xtran9@gmail.com
Former chief policy analyst, Division A Policy, DG XVII Energy, European Commission. Andrew McKillop Biographic Highlights
Co-author 'The Doomsday Machine', Palgrave Macmillan USA, 2012
Andrew McKillop has more than 30 years experience in the energy, economic and finance domains. Trained at London UK’s University College, he has had specially long experience of energy policy, project administration and the development and financing of alternate energy. This included his role of in-house Expert on Policy and Programming at the DG XVII-Energy of the European Commission, Director of Information of the OAPEC technology transfer subsidiary, AREC and researcher for UN agencies including the ILO.
© 2012 Copyright Andrew McKillop - All Rights Reserved Disclaimer: The above is a matter of opinion provided for general information purposes only and is not intended as investment advice. Information and analysis above are derived from sources and utilising methods believed to be reliable, but we cannot accept responsibility for any losses you may incur as a result of this analysis. Individuals should consult with their personal financial advisors.
© 2005-2022 http://www.MarketOracle.co.uk - The Market Oracle is a FREE Daily Financial Markets Analysis & Forecasting online publication.