Gold To Repeat 2011 April, May Gains in 2012?
Commodities / Gold and Silver 2012 Apr 13, 2012 - 09:04 AM GMTBy: GoldCore
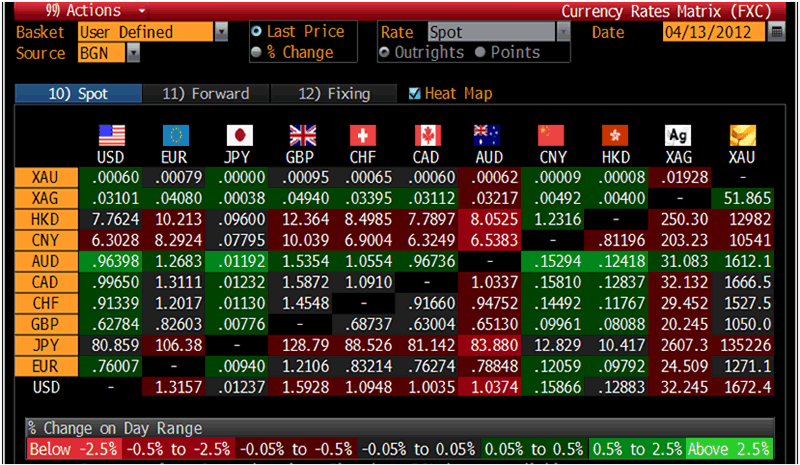
 Gold’s London AM fix this morning was USD 1,670.50, EUR 1,269.86, and GBP 1,048.91 per ounce. Yesterday's AM fix was USD 1,655.50, EUR 1,261.33 and GBP 1,039.04 per ounce.
Silver is trading at $32.39/oz, €24.53/oz and £20.27/oz. Platinum is trading at $1,597.50/oz, palladium at $644/oz and rhodium at $1,350/oz.
Cross Currency Table – (Bloomberg)

Gold rose $17.10 or 1.03% in New York yesterday and closed at $1,675.20/oz. Gold rose sharply in just a few minutes of trade on heavy volume - about 33,000 contracts between 1430 and 1500 GMT. Gold traded erratically but essentially sideways in Asian trading prior to ticking lower in Europe.
Weaker gold prices are being attributed to China's weaker than expected Q1 GDP data. However, Asian equity indices were higher. A slightly stronger U.S. dollar and oil prices back below $103 a barrel (NYMEX) may be contributing to today’s weakness.
China's GDP grew 8.1% which was well below expectations - expanding at its slowest pace since Q1 2009. GDP growth slowed from the 8.9% rise in Q4 of 2011 and was below the average forecast from economists polled by Dow Jones, Bloomberg and Reuters.
The North Korean rocket launch may have led to a safe haven bid which was taken out of the market after the rocket failure.
Gold bullion remains supported, mostly due to a pickup in physical Indian and Chinese gold demand this week. There are expectations of sustained Indian consumption next week in the lead up to the Akshaya Tritiya festival later this month.
Western physical buying remains unusually anaemic - for now.

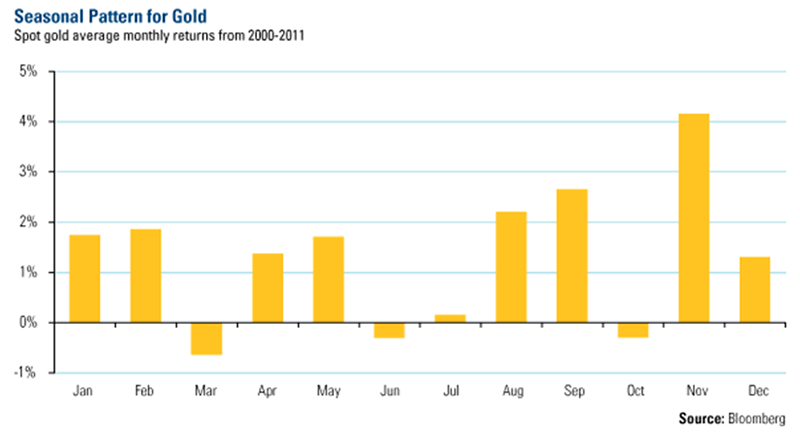
In recent years, April and May have been positive months for gold in terms of returns (see table above).
April has returned 1.4% per annum in the course of the current bull market since 2000.
May has returned 1.75% per annum in the course of the current bull market since 2000.
Interestingly, the last month of Q1 and Q2, March and June, have been negative in terms of returns.
March in particular has seen the poorest returns for any month in the last 11 years with average falls of 0.6%.
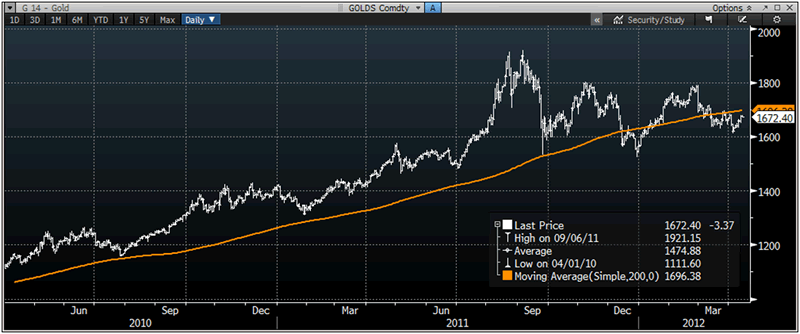
Therefore the very poor performance of gold in March 2012 (-6.4%) may represent another buying opportunity as it did last year (see chart below) and in previous years.
Gold Daily 2 Year Chart – (Bloomberg)

Gold traded marginally lower last March prior to sharp gains in April 2011 when gold rose 8% (silver rose 28%).
This was followed by a correction in May and consolidation in June prior to further sharp gains in July and August.
Looking at the quarterly performance of 2011, gold traded marginally higher in Q1 prior to gains in Q2 and then strong gains in Q3.
Bullion then encountered a sharp correction and consolidation seen at the very end of Q3 which continued into Q4.
This continued in Q1 2012 but the gains in Q1 2012 (6.7% gain in Q1) were important and make the long term technicals favourable again.
While past performance is no guarantee of future returns, these are monthly, quarterly and seasonal patterns that are worth considering and suggest that diversifying on the dip remains prudent
For the latest news and commentary on financial markets and gold please follow us on Twitter.
GOLDNOMICS - CASH OR GOLD BULLION?

'GoldNomics' can be viewed by clicking on the image above or on our YouTube channel:
www.youtube.com/goldcorelimited
This update can be found on the GoldCore blog here.
Yours sincerely,
Mark O'Byrne
Exective Director
IRL |
UK |
IRL +353 (0)1 632 5010 |
WINNERS MoneyMate and Investor Magazine Financial Analysts 2006
Disclaimer: The information in this document has been obtained from sources, which we believe to be reliable. We cannot guarantee its accuracy or completeness. It does not constitute a solicitation for the purchase or sale of any investment. Any person acting on the information contained in this document does so at their own risk. Recommendations in this document may not be suitable for all investors. Individual circumstances should be considered before a decision to invest is taken. Investors should note the following: Past experience is not necessarily a guide to future performance. The value of investments may fall or rise against investors' interests. Income levels from investments may fluctuate. Changes in exchange rates may have an adverse effect on the value of, or income from, investments denominated in foreign currencies. GoldCore Limited, trading as GoldCore is a Multi-Agency Intermediary regulated by the Irish Financial Regulator.
GoldCore is committed to complying with the requirements of the Data Protection Act. This means that in the provision of our services, appropriate personal information is processed and kept securely. It also means that we will never sell your details to a third party. The information you provide will remain confidential and may be used for the provision of related services. Such information may be disclosed in confidence to agents or service providers, regulatory bodies and group companies. You have the right to ask for a copy of certain information held by us in our records in return for payment of a small fee. You also have the right to require us to correct any inaccuracies in your information. The details you are being asked to supply may be used to provide you with information about other products and services either from GoldCore or other group companies or to provide services which any member of the group has arranged for you with a third party. If you do not wish to receive such contact, please write to the Marketing Manager GoldCore, 63 Fitzwilliam Square, Dublin 2 marking the envelope 'data protection'
GoldCore Archive |
© 2005-2022 http://www.MarketOracle.co.uk - The Market Oracle is a FREE Daily Financial Markets Analysis & Forecasting online publication.


