


Elliott Wave Diagonal Straight Shot to a Market Trading Opportunity
InvestorEducation / Elliott Wave Theory Apr 06, 2012 - 04:10 AM GMTBy: EWI

 Today we sit down with Elliott Wave International's Futures Junctures Editor and Senior Tutorial Instructor Jeffrey Kennedy to discuss his favorite wave pattern of all: the diagonal.
EWI: You say if you had to pick just ONE of all 13 known Elliott wave structures to spend the rest of your technical trading life with, it would be the diagonal. First, tell us what the diagonal is.
Jeffrey Kennedy: The diagonal is a five-wave pattern labeled 1 through 5, in which each leg subdivides into three smaller waves: 3-3-3-3-3. Unlike impulse waves, however, diagonals are the only five-wave structures in the direction of the main trend in which wave 4 almost always moves into the price territory of wave 1. (See illustrations below.)
.gif)
EWI: So, what makes this pattern so darn special?
JK: As you can see in the above charts, the diagonal is a terminating pattern. They can only occur in waves 5 of impulses or C-waves of corrections. This is why they're so exciting. Diagonals precede a dramatic change in trend. And, when they end, prices tend to retrace the entire pattern, or more, and fast -- in 1/3 to 1/2 the time it took the pattern to form. Put simply: If you see a diagonal, you know the train of change is coming into the station.
EWI: Well, in your Daily Futures Junctures service, you do, in fact, see a diagonal underway in the recent price action of a major grain market. There, you present the following Elliott wave chart (some Elliott labels have been removed, while I took the liberty to draw a blue circle around the diagonal pattern for clarity):
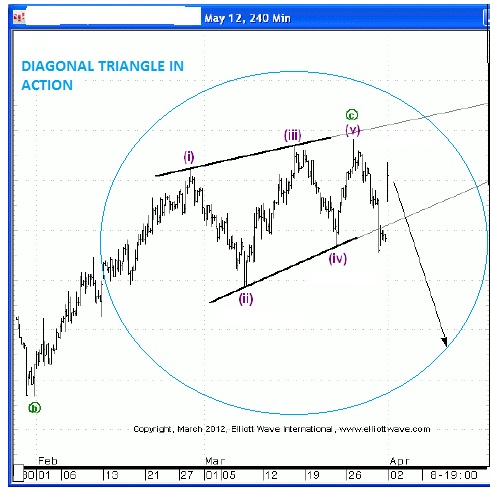
JK: Yes. This is a classic diagonal unfolding in the final wave of the larger trend. As you can see, prices have put the finishing touches on wave (v) of c (circled). And, if my wave count is correct, this market's prices are about to board the "Exciting Southbound Turn" Railway.
EWI: Thank you so much for taking the time to explain the ins and outs of your favorite structure, the diagonal. And also, for alerting readers to the possible DRAMA in store for this major grain market thanks to this Elliott wave pattern.
|
Learn More about Diagonals and Other Elliott Wave Patterns Get a better understanding of Elliott wave analysis with our Elliott Wave Patterns educational feature. You'll have access to basic lessons on Elliott wave patterns, along with video clips from our online courses which will explain the pattern, the rules and the guidelines. Plus, you'll see real-life examples that show you how each pattern fits into the overall wave structure. Some patterns will even offer a brief quiz to test your knowledge and ensure that you understand the material. |
This article was syndicated by Elliott Wave International and was originally published under the headline Diagonal: Straight Shot to a Trading Opportunity. EWI is the world's largest market forecasting firm. Its staff of full-time analysts led by Chartered Market Technician Robert Prechter provides 24-hour-a-day market analysis to institutional and private investors around the world.
About the Publisher, Elliott Wave International Founded in 1979 by Robert R. Prechter Jr., Elliott Wave International (EWI) is the world's largest market forecasting firm. Its staff of full-time analysts provides 24-hour-a-day market analysis to institutional and private around the world.
© 2005-2022 http://www.MarketOracle.co.uk - The Market Oracle is a FREE Daily Financial Markets Analysis & Forecasting online publication.