If You Think All Utility Stocks Are The Same - Think Again
Companies / US Utilities Apr 06, 2012 - 04:01 AM GMT I have recently seen comments on articles oriented to the dividend growth investor where people were suggesting that in general, utilities have recently become overvalued. Further discussion indicated that this was probably due to the fact that bond yields were so low that people were flocking to stable utility stocks in lieu of bonds therefore driving utility stock prices to abnormal highs. This article is primarily designed to take a more specific look at whether or not utility stocks as an asset class are currently overvalued. Secondarily, it is offered to expose the fallacy of thinking in generalities rather than more specifically.
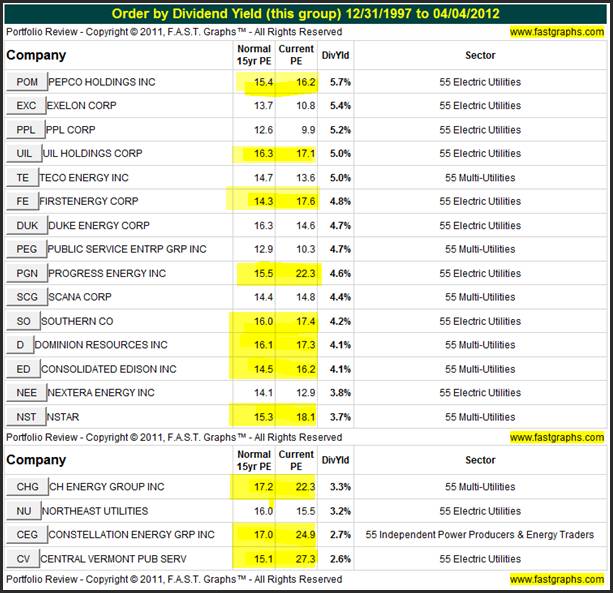
The following graphic looks at 19 prominent utilities operating in the eastern part of the United States. There is no particular reason why I chose eastern utilities over central or western. My objective was to provide a sampling of utility stocks that more or less operated in a similar geographic region of the United States. The table reviews three metrics that are relevant to this article. First I list the company’s historically normal PE ratio since calendar year 1997, and then each company’s current PE ratio is shown in the second column. I have highlighted those companies that have current PE ratios that are higher than their historical norms, thereby indicating overvaluation. Finally, the list was generated in order of the highest current dividend yield to the lowest.
There are a couple of facts regarding investing in utility stocks that I would like to simply mention here, and elaborate more on later in the article with specific examples. First and foremost, almost by definition utility stocks tend to have very low historical rates of earnings growth. Therefore, if bought at fair valuation, the capital appreciation component for the long-term buy-and-hold investor will correlate very closely to the company’s rate of change of earnings growth. Consequently, there is not much of a margin for error because even a modest amount of overvaluation can significantly lower or even negate any potential future capital appreciation. Additionally, current yield will be lessened, and risk increased if you overpay for a utility stock even by just a little bit.
About Southern Company (SO): Directly from their website
Southern Company: The Quintessential Idea of a Utility Stock
“With 4.4 million customers and more than 43,000 megawatts of generating capacity, Atlanta-based Southern Company (NYSE: SO) is the premier energy company serving the Southeast. A leading U.S. producer of electricity, Southern Company owns electric utilities in four states and a growing competitive generation company, as well as fiber optics and wireless communications.”
When prospective investors think about dividend paying utility stocks they tend to have similar expectations regarding exactly what kind of investment a utility stock is. First and foremost, most people envision utility stocks as high yielding stable investments with predictable earnings and low volatility. Therefore, they also consider utility stocks a safe sector. But like bugs attracted to a bright light, it is for the dividend yield that most investors are attracted to utility stocks. Nevertheless, investors expect utility stocks to be stable investments that have consistent earnings growth and a high dividend yield.
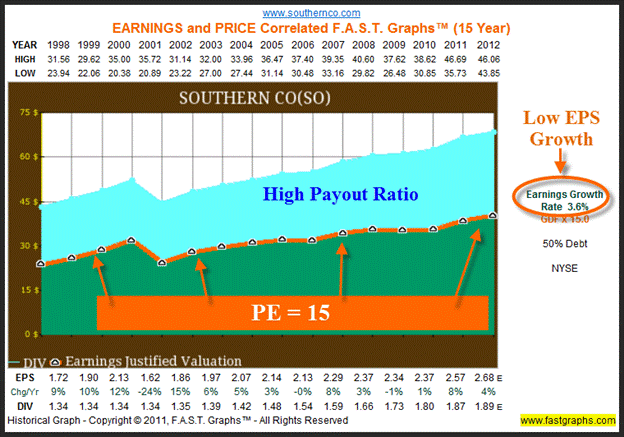
The following earnings and dividends only F.A.S.T. Graphs™ on the well-known utility stock Southern Company classically portrays the perception of stable and consistent earnings and high dividends expected from utility stocks as discussed above. The orange line plots earnings at a PE ratio of 15 and a growth rate of 3.6 %. The light blue shaded area represents dividends paid out of those earnings (the green shaded area) and, as it is visually revealed, we see that the company pays a substantial portion of earnings out as dividends. Therefore, Southern Company is offered as a quintessential example of many people’s perception of the stable high yielding utility stock.
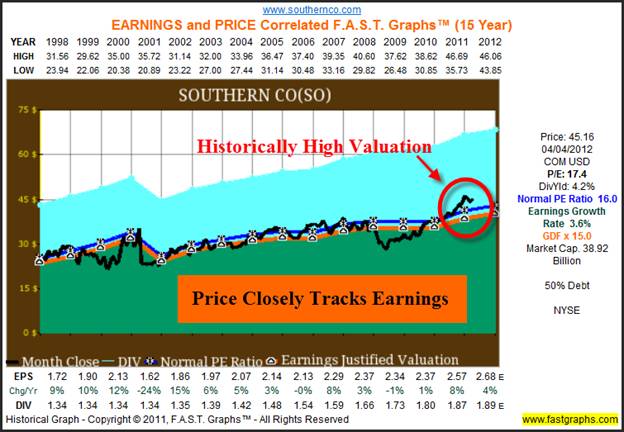
With our second graph, we bring monthly closing stock prices into the equation and discover several important points. First of all, we see that the black monthly closing stock price line very closely tracks the orange earnings justified valuation line over time. We also see a low beta graphically depicted as a picture of stable stock prices, clearly illustrating Southern Company’s low price volatility from one year to the next. Finally, we see that the recent price action has taken the black monthly closing stock price line above the orange earnings justified valuation line clearly illustrating current overvaluation. It’s important to restate that high valuation on a slow growth utility stock has a multiplying negative effect on long-term total return.
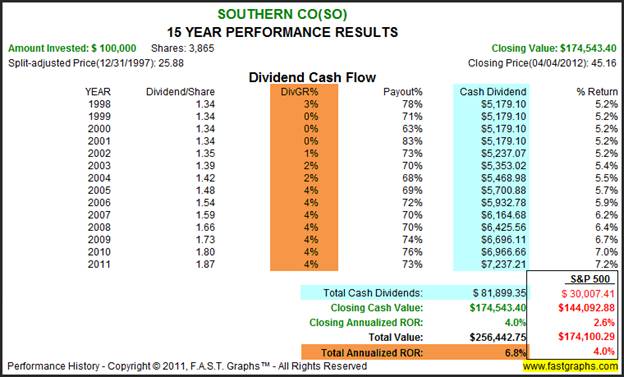
When we examine Southern Company’s performance results since calendar year 1997, we see that capital appreciation closely correlates to the company’s earnings growth rate but that it is slightly enhanced by current overvaluation. Then, as we examine the dividend record we discover that the dividend growth rate is very low, but cumulative total cash dividends have greatly exceeded the dividends on the S&P 500.
Add capital appreciation to the total cumulative dividend (paid out and not reinvested) and we see a very attractive 6.8% return that has exceeded the return of the average company since 1997. Therefore, both the operating results (earnings growth), dividend record and price appreciation from Southern Company argues in favor of considering an investment in utility stocks in lieu of investing in bonds. Especially when the prospective investor is considering today’s low interest rate environment. However, we caution the prospective investor by pointing to Southern Company’s current abnormally high valuation.
About SCANA Corp (SCG): Directly from their website
SCANA Corp: Priced at Fair Value
“SCANA Corporation, a Fortune 500 company headquartered in Cayce, S.C., is an energy-based holding company principally engaged, through subsidiaries, in electric and natural gas utility operations and other energy-related businesses”
Our second example, SCANA Corp, represents another example that fits the common image of a safe, stable and predictable utility stock. Once again, we see a very consistent correlation between the company’s earnings in its stock price over time. The only real difference between Southern Company and SCANA is that SCANA appears fairly valued in contrast to Southern Company’s historically high current valuation. On the other hand, like Southern Company, SCANA has seen its stock price on the rise recently, but not to the extent where it’s become overvalued yet.
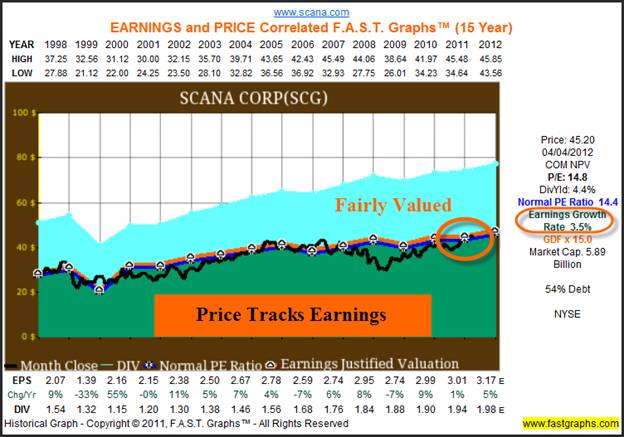
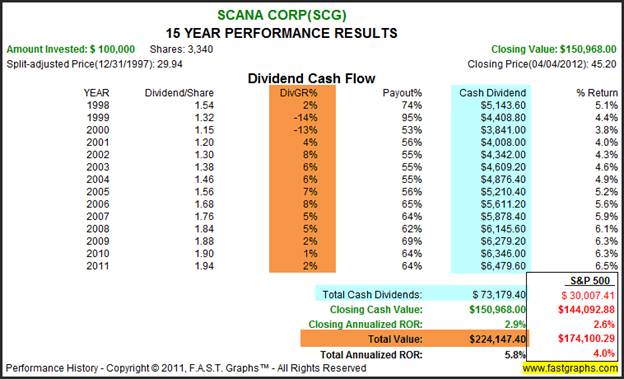
SCANA’s long-term stock price performance, as expected, correlates very closely to its long-term earnings growth rate. However, thanks to its higher than average dividend yield the company’s total return, capital appreciation plus dividend income, exceeded the S&P 500.
Pepco Holdings Inc. (POM) Directly from their website
Pepco Holdings Inc: Less Earnings Predictability
“About PHI : Pepco Holdings, Inc. (NYSE: POM) is one of the largest energy delivery companies in the Mid-Atlantic region, serving about 2 million customers in Delaware, the District of Columbia, Maryland and New Jersey. PHI subsidiaries Pepco, Delmarva Power and Atlantic City Electric provide regulated electricity service; Delmarva Power also provides natural gas service. PHI also provides energy efficiency and renewable energy services through Pepco Energy Services.”
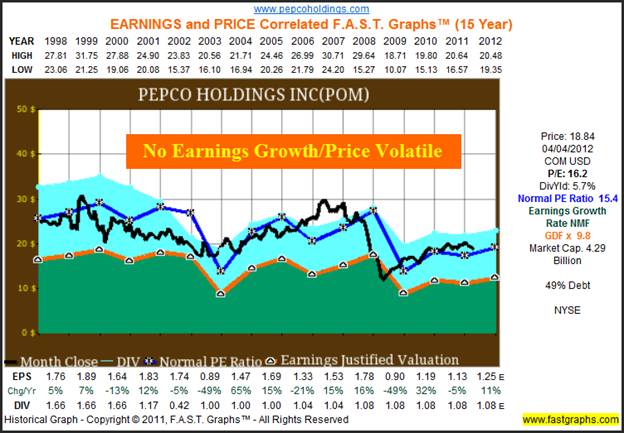
Our third example, Pepco Holdings Inc., is offered to illustrate that not all utility stocks possess the stable and consistent record that we saw with our first two. Not only have earnings growth been less predictable, the rate of growth is negative since 1997. Therefore, we also discover more volatility in the company’s stock price that we traditionally expect from a utility stock. This example is offered to vividly illustrate the importance of specific analysis in lieu of a general bias.
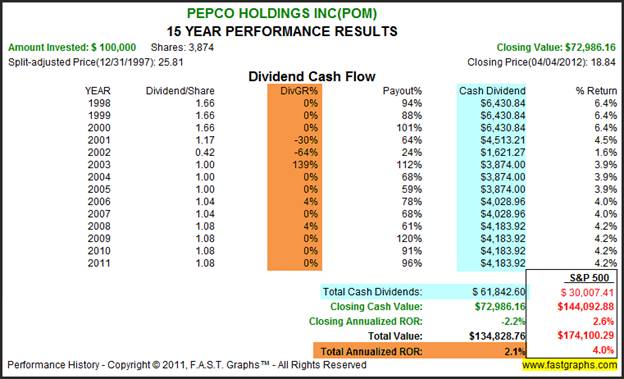
As a side effect of less than consistent and stable earnings, we also discover an erratic record of dividend payments. Consequently, the conservative investor seeking either a stable dividend income stream or a growing dividend income stream would have experienced several disappointments from Pepco Holdings. But perhaps even more telling, is the fact that the long-term buy-and-hold investor would also have lost approximately 27% of their capital holding the stock. On the other hand, an above-average level of total cumulative dividends, as erratic as they are, would have at least eked out a small, but below average total return.
Summary and Conclusions
Generally speaking it is somewhat true that utility stocks, especially regulated utility stocks share certain characteristics that differentiate them from the typical dividend growth stock. However, these common characteristics are not all necessarily positive. On the plus side, utilities are thought of as predictable stocks with low volatility characteristics. Utility stocks also tend to provide a higher current yield than many dividend growth stocks. On the other hand, all of this consistency comes at a sacrifice of growth. Since the typical utility has a significant portion of their businesses regulated, their ability to grow earnings and dividends is restricted.
Therefore, investors interested in investing in utilities stocks should be even more conscious of the valuation they pay before they buy a utility stock. Prospective investors also need to recognize that just because it’s a utility stock does not necessarily mean that price volatility will be low, and/or that dividends will be reliable or even grow. Just like any class of equity, when contemplating utility stocks for income, it’s important to examine the specific company you’re considering. A quick review of its historical operating history and dividend record can provide a great deal of insight into the company as we demonstrated in this article. However, since all investing is done in future time, it’s most important to do the necessary due diligence to determine whether or not you believe that the company’s fundamentals are intact and will persist in the future.
What we hoped to identify with this analysis is the indisputable fact that not all utilities can be painted with the same general brush. Moreover, just because the price of some utility stocks may have risen over the past year or so, does not necessarily mean that it’s become overvalued. As we tried to illustrate with our sample companies, some utility stocks have become historically high priced, while others can still be purchased at valuations that make sense, at least on a historical basis. Therefore, conservative investors seeking income may want to consider utility stocks as viable alternatives to fixed income. Especially considering that fixed income carries an aberrantly high level of risk today. Rising interest rates could cause bond prices to fall, and the low fixed rate of interest offers scant inflation protection. However, a high level of due diligence and selectivity is highly recommended.
Disclosure: Long SCG at the time of writing.By Chuck Carnevale
Charles (Chuck) C. Carnevale is the creator of F.A.S.T. Graphs™. Chuck is also co-founder of an investment management firm. He has been working in the securities industry since 1970: he has been a partner with a private NYSE member firm, the President of a NASD firm, Vice President and Regional Marketing Director for a major AMEX listed company, and an Associate Vice President and Investment Consulting Services Coordinator for a major NYSE member firm.
Prior to forming his own investment firm, he was a partner in a 30-year-old established registered investment advisory in Tampa, Florida. Chuck holds a Bachelor of Science in Economics and Finance from the University of Tampa. Chuck is a sought-after public speaker who is very passionate about spreading the critical message of prudence in money management. Chuck is a Veteran of the Vietnam War and was awarded both the Bronze Star and the Vietnam Honor Medal.
© 2012 Copyright Charles (Chuck) C. Carnevale - All Rights Reserved Disclaimer: The above is a matter of opinion provided for general information purposes only and is not intended as investment advice. Information and analysis above are derived from sources and utilising methods believed to be reliable, but we cannot accept responsibility for any losses you may incur as a result of this analysis. Individuals should consult with their personal financial advisors.
© 2005-2022 http://www.MarketOracle.co.uk - The Market Oracle is a FREE Daily Financial Markets Analysis & Forecasting online publication.


