Five Undervalued Dividend Paying Retail Stocks
Companies / Investing 2012 Apr 03, 2012 - 02:19 AM GMT We believe the retail sector is currently a mixed bag where some of the best names are currently too pricey to buy. Retailers such as Costco (COST), Ross Stores (ROST) and T.J. Maxx (TJX) have seen their share prices skyrocket over the last year or so. On the other hand, not all leading retailers have followed suit even when their operating results have been comparable. We have identified five well-known and even leading retailers that offer attractive valuation, good dividend yields and the opportunity for double-digit total returns over the next five years.
Even though these companies operate in essentially the same sector as the names mentioned above, Mr. Market has not treated them the same. This speaks to the principle that we shouldn't paint all companies with the same general brush, even when they operate in the same industry and possess similar fundamental attributes. Therefore, we believe that investors who are willing to look can find bargains even in industries where some of the competitors have experienced hot streaks with their stock prices.
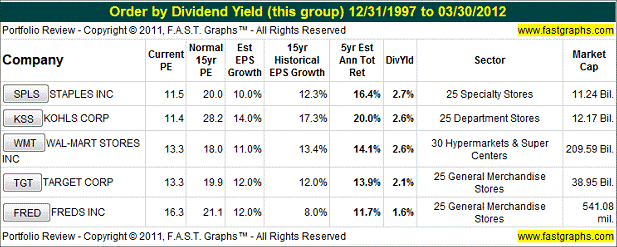
The following table summarizes five retailers that appear to be attractively valued, and lists them in order of dividend yield highest to lowest. From left to right, the table shows the company's stock symbol and name. Next, two valuation metrics are listed side-by-side, the current PE ratio followed by the historical normal PE ratio for perspective. Then the five-year estimated earnings per share growth is shown next to each company's historical EPS growth providing a perspective of the past versus the future growth potential of each company. The final three columns show the current dividend yield, the company sector and its market cap.
A Closer Look at the Past and the Future Potential
Since a picture is worth 1,000 words, we'll take a closer look at the past performance and future potential of each of our five candidates through the lens of F.A.S.T. Graphs™.
Earnings Determine Market Price: The following earnings and price correlated historical graphs clearly illustrates the importance of earnings. The Earnings Growth Rate Line or True Worth™ Line (orange line with white triangles) is correlated with the historical stock price line. On graph after graph the lines will move in tandem. If the stock price strays away from the earnings line (over or under), inevitably it will come back to earnings. The historical normal PE ratio line (dark blue line with*) depicts a PE ratio that the market has historically applied.
The orange True Worth™ line and the blue normal PE ratio line provide perspectives on valuation. The orange line reflects the fair value of each company's earnings relative to its growth rate achievement, and the blue line reflects how the market has traditionally valued the company's stock relative to its fair value. The blue line represents a trimmed historical normal PE ratio (the highest and lowest PEs are trimmed). These lines should be viewed as barometers or aids for ascertaining sound buy, sell or hold decisions. Rather than seen as absolutes, they should be seen as guides to better thinking.
About Staples Inc (SPLS): Directly from their website
"Staples is the world's largest office products company and a trusted source for office solutions. The company provides products, services and expertise in office supplies, copy & print, technology, facilities and breakroom, and furniture. Staples invented the office superstore concept in 1986 and now has annual sales of $25 billion, ranking second in the world in eCommerce sales. With 90,000 associates worldwide, Staples operates in 26 countries throughout North and South America, Europe, Asia and Australia, making it easy for businesses of all sizes, and consumers."
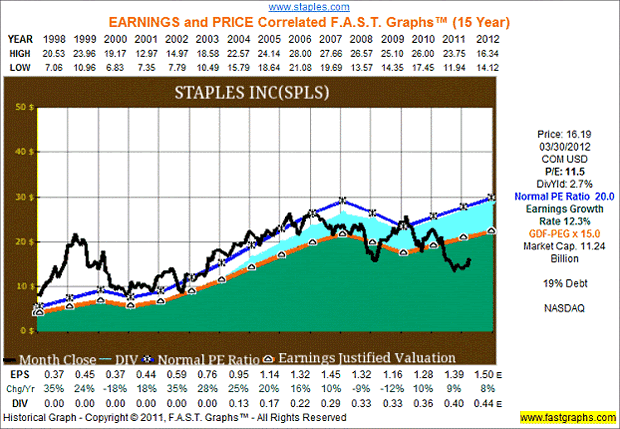
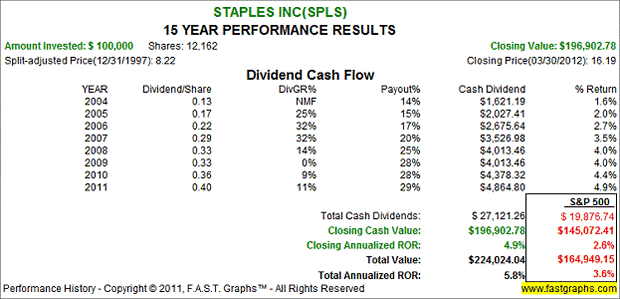
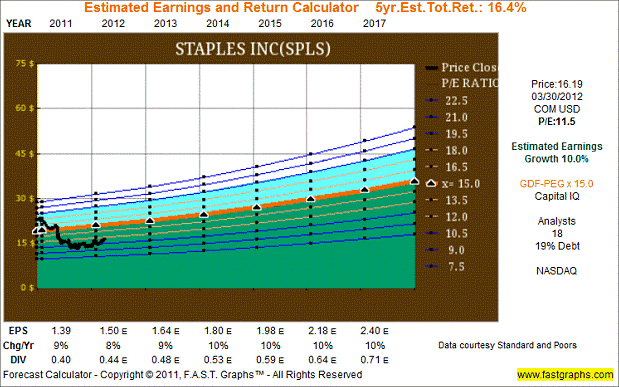
The consensus of 18 leading analysts reporting to Capital IQ forecast Staples Inc's long-term earnings growth at 10%. Staples Inc has low long-term debt at 19% of capital. Staples Inc is currently trading at a P/E of 11.5, which is below the value corridor (defined by the five orange lines) of a maximum P/E of 18. If the earnings materialize as forecast, Staples Inc's True Worth™ valuation would be $36.02 at the end of 2017, which would be a 16.4% annual rate of return from the current price.
About Kohl's Corp (KSS): Directly from their website
"Based in Menomonee Falls, Wis., Kohl's (NYSE: KSS) is a family-focused, value-oriented specialty department store offering moderately priced, exclusive and national brand apparel, shoes, accessories, beauty and home products in an exciting shopping environment. With a commitment to environmental leadership, Kohl's operates 1,134 stores in 49 states. In support of the communities it serves, Kohl's has raised more than $208 million for children's initiatives nationwide through its Kohl's Cares® cause merchandise program, which operates under Kohl's Cares, LLC, a wholly-owned subsidiary of Kohl's Department Stores, Inc"
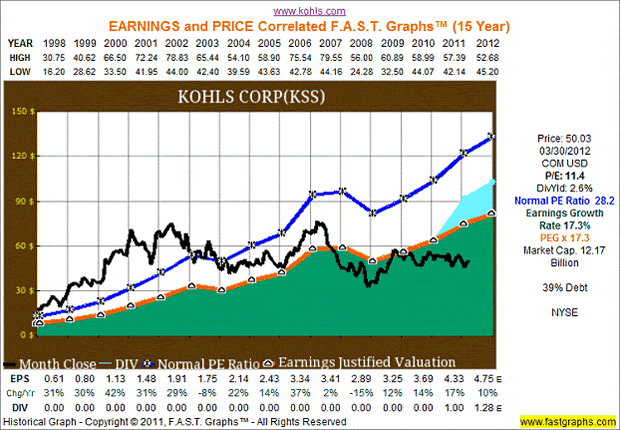
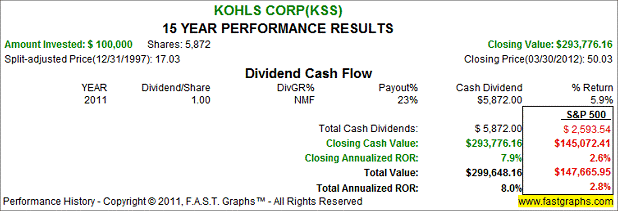
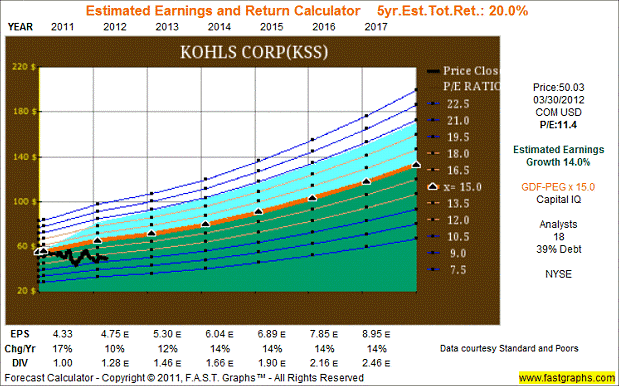
The consensus of 18 leading analysts reporting to Capital IQ forecast Kohl's Corp's long-term earnings growth at 14%. Kohl's Corp has medium long-term debt at 39% of capital. Kohl's Corp is currently trading at a P/E of 11.4, which is below the value corridor (defined by the five orange lines) of a maximum P/E of 18. If the earnings materialize as forecast, Kohl's Corp's True Worth™ valuation would be $134.27 at the end of 2017, which would be a 20% annual rate of return from the current price.
About Wal-Mart Stores Inc (WMT): Directly from their website
"Wal-Mart Stores, Inc. (NYSE: WMT) services customers and members more than 200 million times per week at 10,130 retail units under 69 different banners in 27 countries. With fiscal year 2012 sales of approximately $444 billion, Walmart employs more than 2 million associates worldwide. Walmart continues to be a leader in sustainability, corporate philanthropy and employment opportunity ."
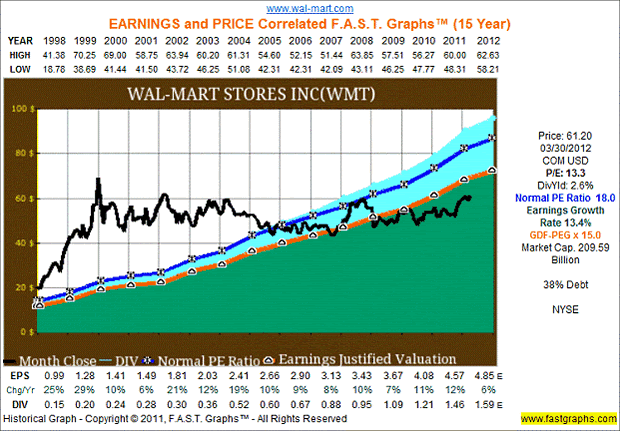
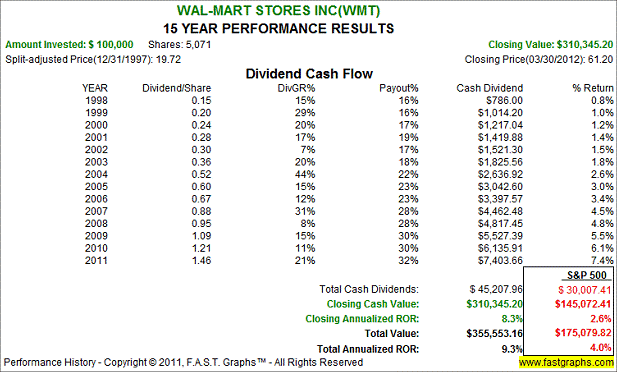
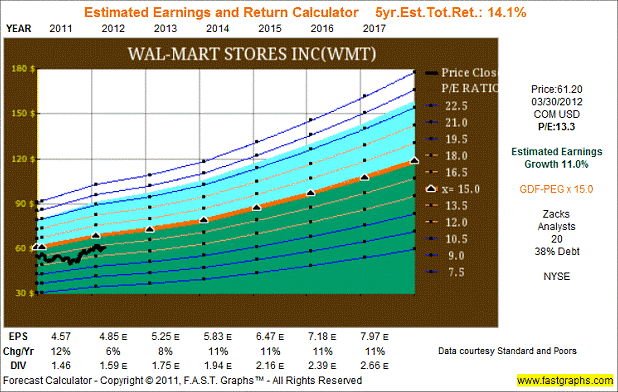
The consensus of 20 leading analysts reporting to Zacks forecast Wal-Mart Stores Inc's long-term earnings growth at 11%. Wal-Mart Stores Inc has medium long-term debt at 38% of capital. Wal-Mart Stores Inc is currently trading at a P/E of 13.3, which is inside the value corridor (defined by the five orange lines) of a maximum P/E of 18. If the earnings materialize as forecast, Wal-Mart Stores Inc's True Worth™ valuation would be $119.55 at the end of 2017, which would be a 14.1% annual rate of return from the current price.
About Target Corp (TGT): Directly from their website
"Minneapolis-based Target Corporation (NYSE:TGT) serves guests at 1,765 stores across the United States and at Target.com. The company plans to open its first stores in Canada in 2013. In addition, the company operates a credit card segment that offers branded proprietary credit card products. Since 1946, Target has given 5 percent of its income through community grants and programs; today, that giving equals more than $3 million a week."
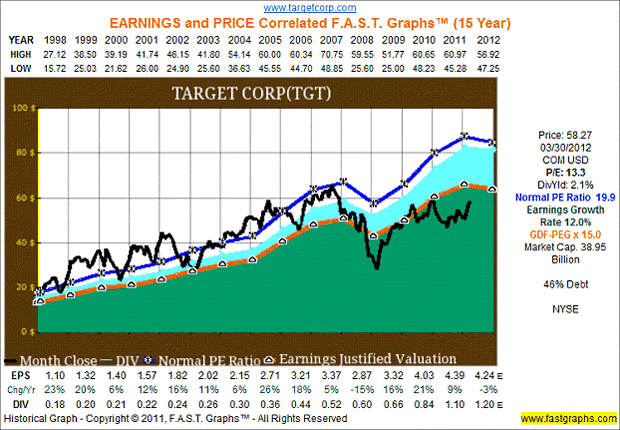
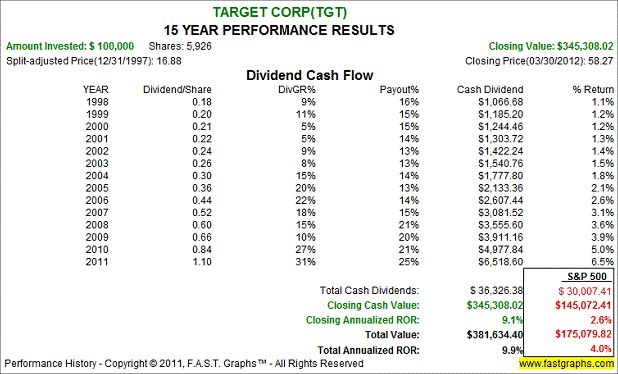
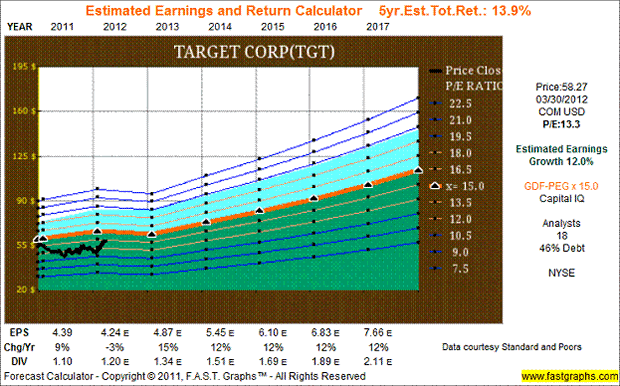
The consensus of 18 leading analysts reporting to Capital IQ forecast Target Corp's long-term earnings growth at 12%. Target Corp has medium long-term debt at 46% of capital. Target Corp is currently trading at a P/E of 13.3, which is inside the value corridor (defined by the five orange lines) of a maximum P/E of 18. If the earnings materialize as forecast, Target Corp's True Worth™ valuation would be $114.83 at the end of 2017, which would be a 13.9% annual rate of return from the current price.
About Fred's Inc (FRED): Directly from their website
"Fred's Inc. operates 700 discount general merchandise stores, including 21 franchised Fred's stores, in the southeastern United States."
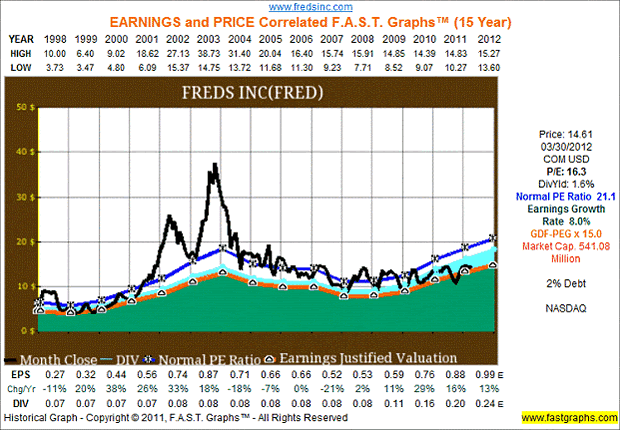
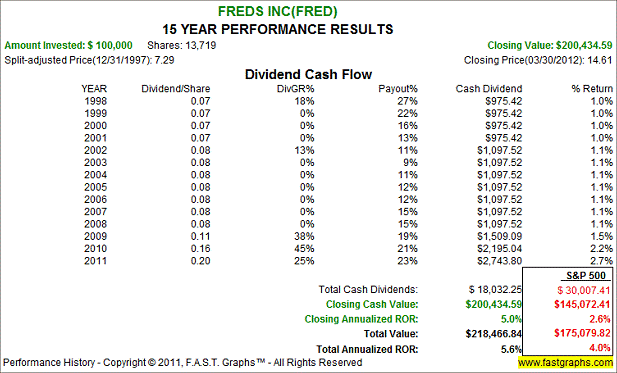
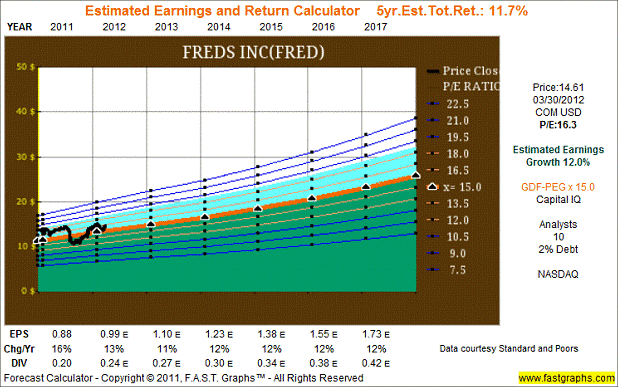
The consensus of 10 leading analysts reporting to Capital IQ forecast Fred's Inc's long-term earnings growth at 12%. Fred's Inc has low long-term debt at 2% of capital. Fred's Inc is currently trading at a P/E of 16.3, which is inside the value corridor (defined by the five orange lines) of a maximum P/E of 18. If the earnings materialize as forecast, Fred's Inc's True Worth™ valuation would be $25.96 at the end of 2017, which would be a 11.7% annual rate of return from the current price.
Summary and Conclusions
We believe that the five retailers covered in this article represent worthy candidates for the prudent dividend seeking investor to explore more deeply. Each offers the combination of dividend yield, historically attractive valuation and double-digit growth potential. We believe that prudent investors seeking above-average total return with a chance for growing dividend would be hard-pressed to find safer or more opportunistic options than the five undervalued retailers reviewed here.
Disclosure: Long KSS at the time of writing.
By Chuck Carnevale
Charles (Chuck) C. Carnevale is the creator of F.A.S.T. Graphs™. Chuck is also co-founder of an investment management firm. He has been working in the securities industry since 1970: he has been a partner with a private NYSE member firm, the President of a NASD firm, Vice President and Regional Marketing Director for a major AMEX listed company, and an Associate Vice President and Investment Consulting Services Coordinator for a major NYSE member firm.
Prior to forming his own investment firm, he was a partner in a 30-year-old established registered investment advisory in Tampa, Florida. Chuck holds a Bachelor of Science in Economics and Finance from the University of Tampa. Chuck is a sought-after public speaker who is very passionate about spreading the critical message of prudence in money management. Chuck is a Veteran of the Vietnam War and was awarded both the Bronze Star and the Vietnam Honor Medal.
© 2012 Copyright Charles (Chuck) C. Carnevale - All Rights Reserved Disclaimer: The above is a matter of opinion provided for general information purposes only and is not intended as investment advice. Information and analysis above are derived from sources and utilising methods believed to be reliable, but we cannot accept responsibility for any losses you may incur as a result of this analysis. Individuals should consult with their personal financial advisors.
© 2005-2022 http://www.MarketOracle.co.uk - The Market Oracle is a FREE Daily Financial Markets Analysis & Forecasting online publication.


