Gold and Silver Are at a 3 Month Cycle Low!
Commodities / Gold and Silver 2012 Apr 02, 2012 - 06:16 AM GMTBy: Bob_Clark

 Investors that are trying to protect themselves from inflation are asking, what is going on with the precious metals? When the world central banks, without exception, are printing money. Why are metals prices declining?
The economists will search in their bag of excuses and find a reason.
Maybe it is that Portugal is the next to default. Then Spain and Italy etc. How about the fact that China has hit a brick wall and probably has zero growth now.
Where the truth lies
The truth is, there is a battle between the forces of inflation and deflation. Both sides have valid arguments and the Fat Boys are right in the middle, stealing as much money as they can.
We clearly see signs of manipulation as the stock market is driven higher and the metals are hammered.
Traders are knuckling under and abandoning other investments for the safe profits in the general stock market. The Fed, with the help of the FBs, have succeeded in herding the crowd into only one investment vehicle, stocks.
It will not last
We have to ask ourselves, where have we seen this movie before. Trust me we have. The FBs will take the other side at some point and attack with full force. That is how they survive and prosper.
So what does that mean for the metals? Is there a technical reason for this decline? When will it end?
Cycles
A look at the cyclical situation never hurts and this time it is very telling.
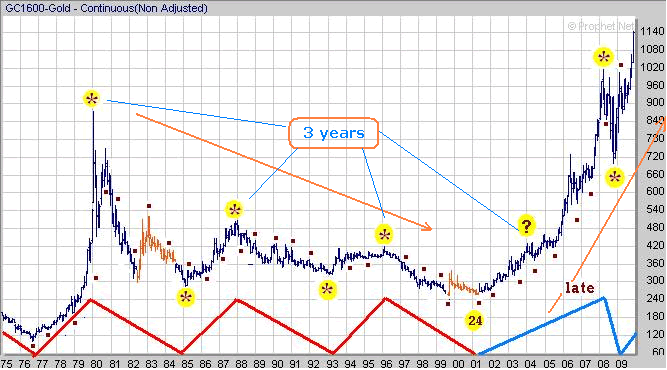
The first chart below is a multi year chart of gold. It is from a previous 2009 article (Gold, a cyclical recipe for disaster). In which I said gold had much further to go on the upside.
What we see is that there is a strong 8 year cycle. That is vitally important now. Why? Because it is 4 years since we made the last important low. So what? Well major cycles tend to have half cycles.
The other thing to know is that cycle lows are usually fairly consistent but where the high is made in a cycle can vary. This is important. If the underlying trend, which is the big force in the market, is still going up (in this case it would all be the cycles bigger than 8 years). Then the smaller cycle, in this case the 8 year cycle, should not make it's next high until late in it's cycle. Much like it did in 2008. That means the top we have seen it too early. That means this correction will end soon and we will go much higher. It means we will not make the major top until year 6 or 7, which means 2014 or 2015.
Most importantly that means this is an excellent chance to buy low.

The trend is up
Looking at the upper multi year chart one more time, we see that until 2001, we topped the 8 year cycle after 3 years of strength. Except the last one! The reason for the early translation pre 2001 is that we were in a bigger down trend. Now the bigger trend is up!
Can we flip from late translation to an early one? Which means the really big cycles have turn sharply lower. Yes but it is not likely.
It is a half cycle low
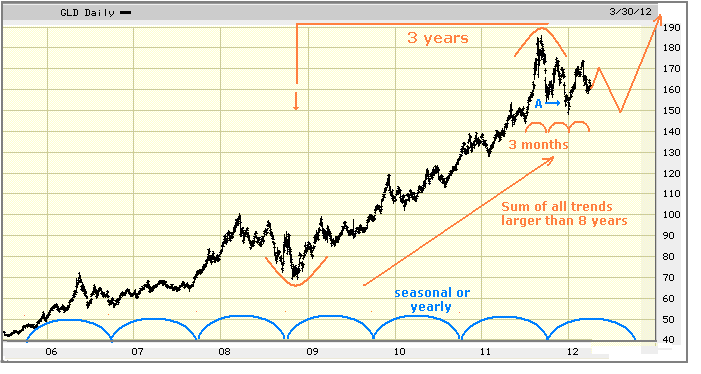
Below is a chart of GLD which I have used to represent gold. We see that after 3 years up, we have faltered again. That has the analysts calling the end of the metals rally. They are wrong.
Yes we have broken the seasonal low from last year. Yes the decline is bigger than any since the low in 2008 but that is because we are half way through the 8 year cycle. This is normal.

The bottom line
We see on the chart that gold tends to make a low in the summer, most years. If that tendency continues, then we can expect a seasonal low in the July to August time frame.
If we look even closer, we see that the metals have a 3 month cycle. We should be bottoming that cycle right now! The next low will be the end of June, which takes us into the summer.
Using those cycles in combination with the big forces already at work, I am making the assumption that because we broke the last 1 year low, we will stay sideways to down as illustrated until this summer. At that time the bull move will resume and we will go much higher. My target is $2400 on cash gold.
We may go a little lower than what I have drawn. I can not guarantee the double bottom holds yet. We will know better when we see how well this 3 month cycle acts. If it rolls over early, that would be a bad sign and we may push briefly under 140. Short term traders have to be picking at the long side for now. Watch for an early translation of this 3 month cycles. The same timing strategy applies to silver and the metals stocks.
IF
If you missed the October bottom in the stock market. If you rushed into the metals on the highs and are scared now.
If you want to learn how to day trade the stock index futures for a living. I have the key you need.
My full course will have you trading confidently at a professional level quickly. I guarantee it.
There is no time limit. We work together one on one, until you are trading successfully. I have no failed students. You learn the entry points of the Fat Boys.
I also offer five, two hour videos that teach my trading method, so you can learn at your own pace.
Bob Clark is a professional trader with over twenty years experience, he also provides real time online trading instruction, publishes a daily email trading advisory and maintains a web blog at www.winningtradingtactics.blogspot.com his email is linesbot@gmail.com.
© 2012 Copyright Bob Clark - All Rights Reserved
Disclaimer: The above is a matter of opinion provided for general information purposes only and is not intended as investment advice. Information and analysis above are derived from sources and utilising methods believed to be reliable, but we cannot accept responsibility for any losses you may incur as a result of this analysis. Individuals should consult with their personal financial advisors
© 2005-2022 http://www.MarketOracle.co.uk - The Market Oracle is a FREE Daily Financial Markets Analysis & Forecasting online publication.


