Stock Market Trend Similarities to the Last Two Aprils
Stock-Markets / Seasonal Trends Mar 31, 2012 - 02:11 AM GMTBy: Sy_Harding

 Almost a year ago in this column I pointed out the eerie similarities in April (2011) to conditions the previous April (2010). And sure enough the similarities continued into almost identical 20% market corrections before the bull market resumed.
And here we are again this year looking at eerie similarities as March draws to a close, this time to the last two Aprils.
I’m hearing a lot of assurances that this time is different. It would defy the odds for the market to follow an identical pattern for three straight years. Besides it’s an election year, and already the Fed is making noises about coming to the rescue if needed.
Using that logic it would also defy the odds that surrounding conditions would follow the same pattern for three straight years. But that is just what is happening.
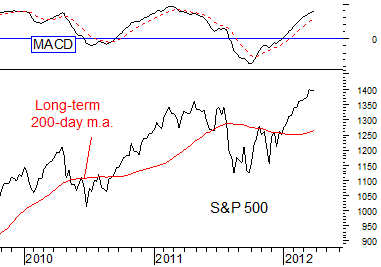
Like the last two years, the S&P 500 has had an impressive rally to a potentially overbought condition above its long-term 200-day m.a., and technical indicators, while still on buy signals, are in their overbought zones.

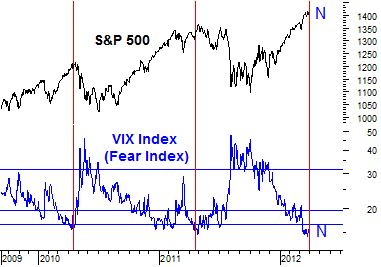
Meanwhile, investor sentiment, usually very bullish at market tops and very bearish at market bottoms, has reached high levels of bullishness, low levels of fear, similar to what was seen near the market peaks in April 2010, and 2011.
That can be seen in the VIX Index, also known as the Fear Index. It is usually at high levels of fear at correction lows and good buying opportunities, and at low levels of fear (high levels of bullishness and complacency) at rally and market tops.

Then there is the U.S. economy. In each of the last two years the economic recovery showed surprising strength during the fall and winter months, and then as we approached April economic reports began showing the recovery to be stumbling.
This year has been an identical repeat so far, with surprisingly strong economic reports through the winter, but a string of negative surprises in the last couple of weeks, including unexpected reversals in home sales and home prices, in the Fed’s business and manufacturing indexes, and in consumer confidence. On Wednesday it was reported that the Chicago Fed’s National Activity Index, designed to gauge economic activity nationally, fell into negative territory last month for the first time in three months.
In each of the last two years, dark clouds also floated in from Asia in the form of concerns that China was going to slow its economy too much in an effort to ward off rising inflation, and from Europe in the form of worries that the eurozone debt crisis would implode and plunge European economies into recessions.
And here we are this spring, with major Asian markets in sharp declines over indications that China has indeed slowed its economy into what will be a hard landing, and evidence that the 17-nation eurozone is already in recession.
Also in each of the last two years, as the Federal Reserve’s April FOMC meeting approached, in the wake of strong economic reports during the winter months, Fed Chairman Bernanke said the economic recovery was looking good, but the Fed was concerned about continuing high unemployment, and stood ready to provide further monetary easing if needed.
In his speech last week, Chairman Bernanke indicated the Fed believes the recovery continues but is suspicious of the improvement in employment, and stands ready to provide further easing if it becomes necessary.
If the eerie similarities should continue it might be well to keep in mind that the market topped out on April 26 in 2010, and April 29 last year, forcing the Fed to come to the rescue during the summer months.
I know, I know. It can’t happen three years in a row. But so far it actually is, even including the super strong rally of the last two quarters.
Sy Harding is president of Asset Management Research Corp., and editor of the free market blog Street Smart Post.
© 2012 Copyright Sy Harding- All Rights Reserved
Disclaimer: The above is a matter of opinion provided for general information purposes only and is not intended as investment advice. Information and analysis above are derived from sources and utilising methods believed to be reliable, but we cannot accept responsibility for any losses you may incur as a result of this analysis. Individuals should consult with their personal financial advisors.
© 2005-2022 http://www.MarketOracle.co.uk - The Market Oracle is a FREE Daily Financial Markets Analysis & Forecasting online publication.


