Quorum Sensing and Its Application to Computer Program Trading of Financial Markets
Interest-Rates / Learn to Trade Mar 27, 2012 - 10:31 AM GMTBy: David_Petch
 This article is going to throw another idea into the pot about computer based algorithms with an idea borrowed from Microbiology titled “Quorum Sensing”. Nature has been in the business of survival and evolution for billions of years, so it should come as no surprise to most that artificial intelligence and computer based design have been borrowed from studying the human mind. Now what do microbes have to do with how computer based trading is performed. A short-course in Microbiology will be required, but it will quickly be tied into how trading software is “sensing” its environment and how the common investor can use this knowledge to derail these trading patterns.
Theory
Quorum sensing within bacterial populations involve opportunistic pathogens slowly dividing and remaining below the detection of the human immune system. When a suitable sized population has developed and chemical-based signal feedback from a suitable population has been established, a series of genes are activated which then cause rapid proliferation, thereby overwhelming the host and not allowing the immune system an appropriate amount of time to generate an immune response, whether it is innate or an antibody-mediated response. Quorum sensing is dependent upon distribution and concentration of a population which in a nutshell, a response is based upon a threshold number of components detected to induce a response.
Insect populations us quorum sensing to determine where to nest, so at any level, a “component” could be a chemical-based signal concentration from bacteria or a certain number of visible insects...there really is no limit to the imagination where this principle takes place. The important thing to understand is that the “component must be quantifiable. So, how does this principle fit into trading?
There have been numerous articles in publication as of late regarding computer based algorithms and how they can literally trade. An interesting point stated that 1 nanosecond was how quick trades could be initiated. Generally for every seller, there has to be a buyer, so if one computer wants to buy puts or calls, there in theory should be a an opposite trade hitting the market. The problem with this system is that naked shorting is often implemented and even if a nanosecond trade is implemented and then pulled, it can set of a cascade of events that can exacerbate a trend. Although this sort of trading activity can have short-term implications, a bull market trend can never be stopped...an example of this is gold because if Central Banks had their way, gold would still be at $252/ounce.
Having algorithms based upon certain technical metrics or tuning Bernanke speech comments into 1's and 0's with other collective information to generate a sell or buy signal can have benefits, but if the wrong trade is made, then events such as MF Global can happen. Quorum sensing requires examination of components within a given system or systems under study to determine if a certain threshold has been reached, based upon concentration and distribution. As an example, 5x10⁶/unit area represents a trigger for a quorum sensing response, but if it is spread out over a larger area (distribution), the concentration is not at a threshold level to generate a response. Area could also apply to demographics, or more importantly, volume.
The notion that volume precedes price is an stock market adage as old as the hills, yet this has direct application in today's market. Volume sounds simple but it has many derivative measurements that can quickly make one's head spin: shares/minute, ratios of share changes in a given sector, integral of share volume, $/number of shares/minute etc. Etc. What could take an individual a solid day to compare metrics can be completed by a computer in a very short period of time, with an answer spit out as “buy”, “sell”, “short” etc.
Each individual component of a computer algorithm may be simple, but layering many different components into the mix with integrals (summation) and derivatives (rate of change) quickly becomes infinitely complex but in the end, the generated result is simple, either DO or DO NOT for executing a trade. With computer based trading, trying to trade the short-term will work against anyone, because one second can be broken down into 1x10⁹ seconds (nanosecond), which as Cris Sheridan pointed out is equivalent to 31.7 years. To succeed, investors must think of time with respect to geological time scales such as Eon and Supereon if trading can be performed at 1 nanosecond.
Computer based trading causes events that may have taken longer to unfold happen in a much more condensed format. Establishing positions in rising trends with some technical analysis can alleviate attempts to get thwarted out of positions, but investing in gold and silver stocks as well as bullion itself have seen most participants witness the inherent volatility. Never use leverage in these markets, because a downward move can literally wipe you out...play with the chips you have in your hand and that is it.
For every offence, there is a defence, so what methods are available to counter quorum sensing in financial markets? Translating FED or Presidential speeches into probability codes for market reaction is easy...different agencies or news feeds could have double speak, which would essentially be “Quorum Quenching”...a disruptor causing a breakdown of the internal communication between components to “sense” that an appropriate density/concentration has been established. Many new Biotech drugs are being developed to disrupt quorum sensing of pathogenic bacteria, such as MSRA.
Since, many different companies are likely to employ some version of quorum sensing, it should not be viewed as illegal to combat it. Quorum sensing based upon volume analysis is rather hard to come up with a method of disrupting algorithms, but if they are tied into market events or news, then having news statements written such that an either/or situation arises would likely cause computers to not generate an execution order (buy, sell, go short etc.). It is nearly impossible to combat software that has quorum sensing, so the only way as an average investor it to follow the advice of a quarterback... “Go Long”.
Tying this into the Contracting Fibonacci Spiral Cycle I came up with last July, entering at stock market bottoms and at stock market tops will be important, because the swings of the market will be huge based upon the nature of positioning we are within the cycle, coupled to computers sensing when a mid-term top is put in place. Computers are based upon human emotion, so the best way to fight fire is with fire. Know the important points for entry and exit and get out before computer software executes large trades that reverse the general trend. Software that has neural network capacity with quorum sensing will require having superior source code as the CFS oscillations really begin to tighten up...otherwise a company has the ability to go bankrupt in milliseconds going forward.
We have precise dates for when the broad stock market tops out, along with precious metals based upon the CFS, so these points in the future should be respected. There will be significant volatility going forward, yet there will be order within the chaos.
Application
The first portion of the article was rather heavy into the theory of Quorum Sensing, but was required to give a really good feel for how it works and how it is difficult to avoid unless future time points for market turns are known. This is probably the easiest way to perform Quorum Quenching...anticipate what computers will do and then align trades for riding the trend. The following three charts with complete analysis are based upon Elliott Wave analysis, but have time assignments with heavy influence from the CFS, full stochastics and Bollinger bands on daily, weekly and monthly charts.
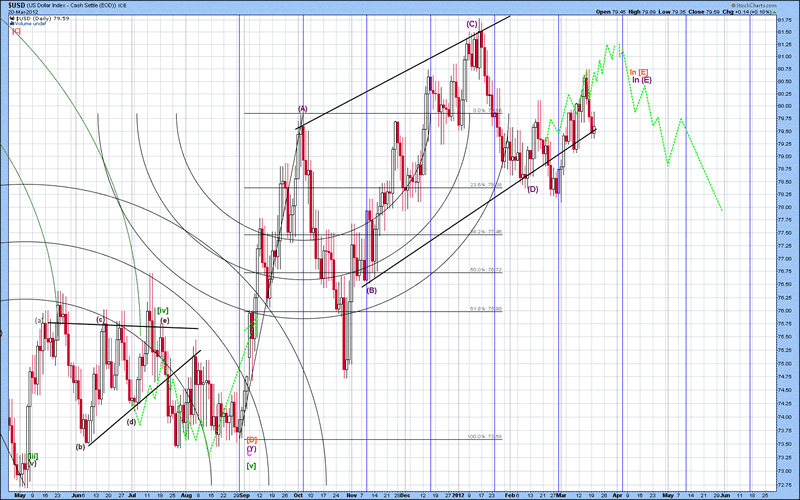
The short-term Elliott Wave count of the US Dollar Index is shown below, with the thought pattern forming denoted in green. Although a top is indicated for early April, action of the past few weeks suggest it may extend into mid to late April. The move up since September represents a contracting triangle. This lower Degree wave is part of a larger triangle pattern that appears to be upside exhaustion pattern. For this pattern to have credence, the decline must retrace the move to the breakout point of 73.58 in an equivalent or lesser amount of time that it took to form...if so, then this pattern has been accurately depicted. This would put the latest point in time to break beneath 73.58 at 8 months out, or November....I expect this level to be tested no later than August. A 2-4 month battle between 72-73.5 will ensue, followed by a very sharp decline to the 64-66 area....this level should be reached no later than summer 2013.
Figure 1

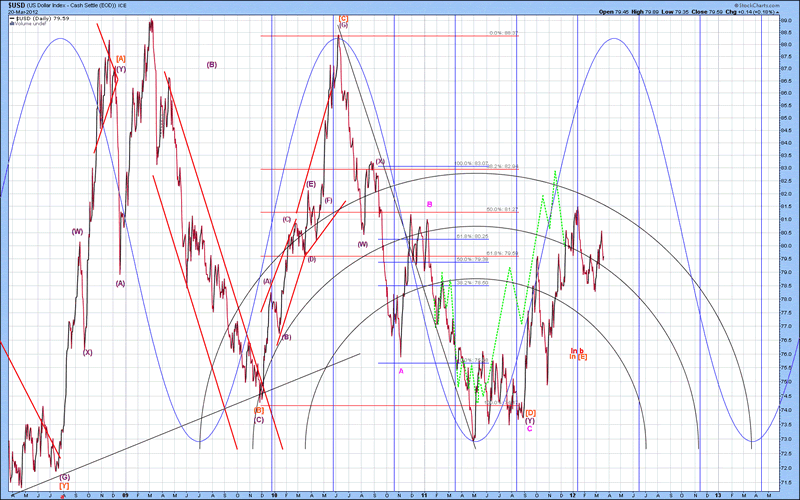
The mid-term Elliott Wave count of the US Dollar is shown below, with the thought pattern forming beneath in green. The US Dollar took 4 months to bottom longer than anticipated last summer, so mentally shift the pattern over 4 months and it fits rather well. At present, wave [E] of a triangle forming since 2008 appears to be nearing completion, with a high degree of correlation in price action for waves [A], [B], [C] and [D] (a uniform triangle??)...wave [A] was the most violent move of all, which fits with a triangular classification. At present, the % retracement of wave [C] was 50%...I was looking for a move to 61.8% but this given weakness is extremely bearish for the US Dollar over the course of next 10-18 months. Two key important support levels are 73.5 and 72.0...the US Dollar should have a 2-4 month battle in this range beyond August before breaking down and trying to establish a bottom. Natural Fib supports lie at 64-66, based upon downside projections for breaking beneath a long-term triangle. When the US Dollar does bottom in early to mid 2013, it will start to rise as deflation kicks in, which in turn will promote a liquidation of all tangible assets as loans etc. are called in. A rise in the US Dollar to the 72 level should occur, which suggests that the price of gold with the US Dollar at 72.0 is where before breaking down is approximately where it can be expected to correct to. We are looking for approximately $3000/ounce gold in early to mid 2013, with a minimum correction to at least $2200-2400/ounce. We are in a very choppy environment that will only get choppier going forward...
Figure 2

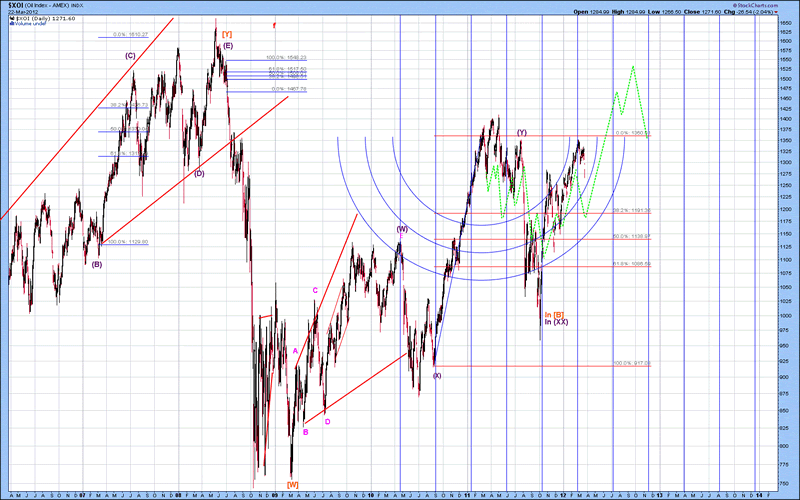
The long-term Elliott Wave analysis of the XOI is shown below, with the thought pattern forming denoted in green...not a perfect fit, but it is following the overall trend. Expect to see a decline to at least the 1138-1191 area before heading higher...please note that 1191 is the minimum expected value to be seen before the present correction is over. I have a top indicated in October, but it more than likely will extend into late November/early December. Do not forget that high oil prices will eventually stop the economy...the broad stock market will sense this 6 months out, so commodity prices could keep barrelling higher without stock market participation until June 2013. Please note that the HUI could be the exception to the rule, given 18 months of sideways price action...a move to the upside in gold stocks is not expected to occur until mid to late April due to strength in the US Dollar.
Figure 3

To summarize, “If you can't beat'em, join'em”...it is impossible to trade against a computer that can literally complete a trade cascade before one can even click the mouse to execute a personal trade. To counteract this, make sure that the current market environment is thoroughly understood and know when the time posts for when market tops and bottoms are due to arrive on the journey through time. Easier said than done, but this is the only way the average investor can stand a chance...positioned trading within defined market trends.
So far, the CFS has aided immensely at being on the right side of the market since last July...granted the depth of declines can be hard to predict, but nonetheless, the market has been following the preset course we are on. CFS is based upon the collective human psychology and how the markets respond along with social mood at a particular point in time is related to this. I am certain once the CFS has completed, it will eventually be accepted and add a new dimension into Socioeconomics, but for now, is likely to be viewed in disbelief. For anyone who is interested in learning more about the CFS, simply Google my name alongside Contracting Fibonacci Spiral and 6 different articles should pop up. If one goes to http://www.safehaven.com/author/21/david-petch the top 7 articles, starting with 7th down are all the published series on the Internet.
I am sure there are novel ways of Quorum Quenching that could disrupt large company software...by trade I am a scientist in Biotech, so computer programing is a very long stretch from my formal training...perhaps others with training in this area may post articles on how quorum quenching strategies. Some of the best applications in some fields however often have “borrowed” concepts from others.
Have a great day.
By David Petch
http://www.treasurechests.info
I generally try to write at least one editorial per week, although typically not as long as this one. At www.treasurechests.info , once per week (with updates if required), I track the Amex Gold BUGS Index, AMEX Oil Index, US Dollar Index, 10 Year US Treasury Index and the S&P 500 Index using various forms of technical analysis, including Elliott Wave. Captain Hook the site proprietor writes 2-3 articles per week on the “big picture” by tying in recent market action with numerous index ratios, money supply, COT positions etc. We also cover some 60 plus stocks in the precious metals, energy and base metals categories (with a focus on stocks around our provinces).
With the above being just one example of how we go about identifying value for investors, if this is the kind of analysis you are looking for we invite you to visit our site and discover more about how our service can further aid in achieving your financial goals. In this regard, whether it's top down macro-analysis designed to assist in opinion shaping and investment policy, or analysis on specific opportunities in the precious metals and energy sectors believed to possess exceptional value, like mindedly at Treasure Chests we in turn strive to provide the best value possible. So again, pay us a visit and discover why a small investment on your part could pay you handsome rewards in the not too distant future.
And of course if you have any questions, comments, or criticisms regarding the above, please feel free to drop us a line . We very much enjoy hearing from you on these items.
Disclaimer: The above is a matter of opinion and is not intended as investment advice. Information and analysis above are derived from sources and utilizing methods believed reliable, but we cannot accept responsibility for any trading losses you may incur as a result of this analysis. Comments within the text should not be construed as specific recommendations to buy or sell securities. Individuals should consult with their broker and personal financial advisors before engaging in any trading activities as we are not registered brokers or advisors. Certain statements included herein may constitute "forward-looking statements" with the meaning of certain securities legislative measures. Such forward-looking statements involve known and unknown risks, uncertainties and other factors that may cause the actual results, performance or achievements of the above mentioned companies, and / or industry results, to be materially different from any future results, performance or achievements expressed or implied by such forward-looking statements. Do your own due diligence.
Copyright © 2012 treasurechests.info Inc. All rights reserved.
Unless otherwise indicated, all materials on these pages are copyrighted by treasurechests.info Inc. No part of these pages, either text or image may be used for any purpose other than personal use. Therefore, reproduction, modification, storage in a retrieval system or retransmission, in any form or by any means, electronic, mechanical or otherwise, for reasons other than personal use, is strictly prohibited without prior written permission.
David Petch Archive |
© 2005-2022 http://www.MarketOracle.co.uk - The Market Oracle is a FREE Daily Financial Markets Analysis & Forecasting online publication.


