Stock Market Rally Another Pause or Something More?
Stock-Markets / Financial Markets 2012 Mar 26, 2012 - 01:41 AM GMTBy: Andre_Gratian
 Current Position of the Market
SPX: Very Long-term trend - The very-long-term cycles are down and, if they make their lows when expected (after this bull market is over) there will be another steep and prolonged decline into late 2014. It is probable, however, that the steep correction of 2007-2009 will have curtailed the full downward pressure potential of the 120-yr cycle.
SPX: Intermediate trend - The intermediate uptrend is still intact, but a short-term top is forming.
Analysis of the short-term trend is done on a daily basis with the help of hourly charts. It is an important adjunct to the analysis of daily and weekly charts which discusses the course of longer market trends.
Market Overview
3/18/12 - "There are signs that the rally which started at 1159 is just about ready for a consolidation/correction. Although there are higher projections, the SPX could pause at 1407-1411 and, if that is exceeded, at 1427."
The SPX did find a top at 1414, slightly above the projection, and has now pulled back for four days. In time, this equals the retracement from 1278, but it may not yet be over. Minor cycles are due to bottom early next week and could keep the consolidation going.
Structurally, have we now completed 5 waves from 1159? If we have, the consolidation should be longer and deeper. If we are still working on wave 5, it should remain shallow. An initial P&F projection to 1386 was completed on Friday, followed by a rally. A good case could be made for a lower move to about 1380. If we have completed 5 waves and made a short-term top, there should be additional distribution leading to lower counts, and it would be normal to retrace to the level of the former 4th wave, which is 1340.
In order to confirm a short-term top, the overall technical picture will have to become more conclusive. For instance, the VIX is still hanging around its correction lows and would need to turn up. More importantly, the SPX, which is still trading above its daily up-trend line, would have to break it. Even a move down to 1380 would not be decisive. On the other hand, a rally which fails to make a new high could be a sign of more distribution, reinforcing the notion of a completed wave five and leading to a deeper correction.
Chart analysis
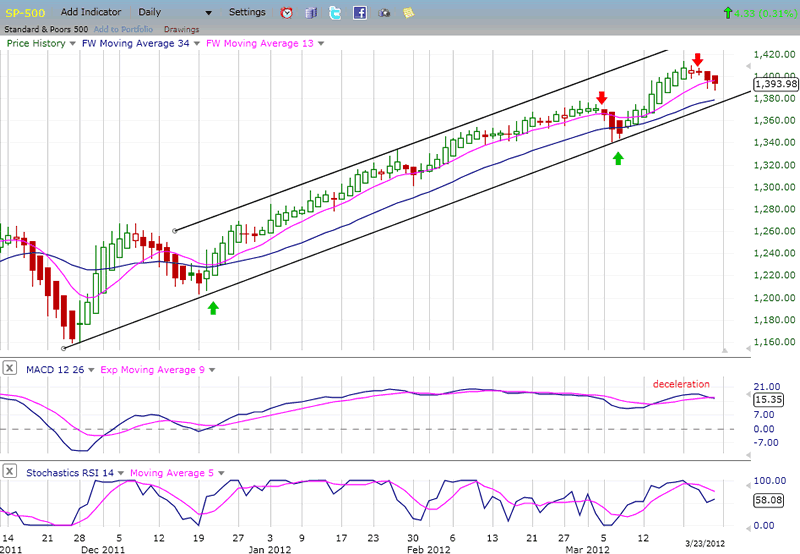
This SPX Daily Chart shows a potential reversal which is in its initial stages. The index has met an interim P&F target, as well as some corresponding Fibonacci projections. There is an apparent completion of 5 waves from 1159. The index has turned down and is now challenging its shortest moving average. The stochastic RSI has turned down and the MACD is ready to go below its MA.
That's only a start. In order to confirm a short-term top which could last a couple of weeks, the index would have to continue its decline and break its up-trend line. That would mean trading decisively below 1380. If Monday's top in the SPX was caused by the 14/15-wk high-to-high cycle, the decline should be at least twice as long, and a re-test of 1340 would be normal. Historically, this cycle has consistently produced reversals of approximately 75 points on average.
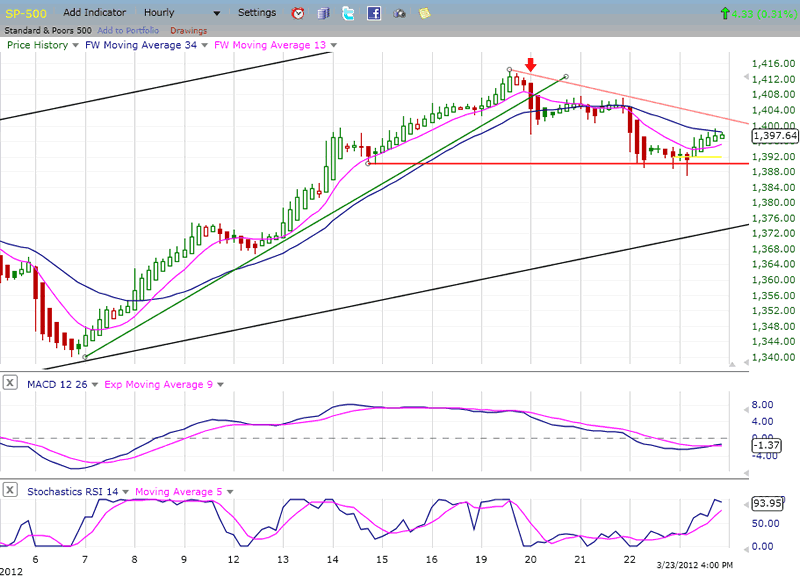
On the Hourly Chart, we see that declining prices found support at a former near-term low. That low corresponded to a retracement of about .382 from 1340 and to a minor P&F projection to 1386. In addition, a minor cycle made its low on Friday. All this contributed to a weak reversal which met with resistance at its 34-hr MA by the end of the day.
There are more minor cycles due on Tuesday-Wednesday which could cause the SPX to turn down once again, and perhaps break below its support line. If this happens, we could see a drop to the 1380 area. Failure to break below 1386 - especially if the index holds above that level for the next couple of days - would be a sign of strength which could end the consolidation and send prices toward the next P&F target of 1427.
The bottom trend line is the trend line from 1159. You can see that even if the decline continued to 1380, it would not be sufficient to break the daily trend line, but it would add a 5th down wave to the decline, increasing the possibility of a deeper correction.
With Friday's rally, the indicators turned up again, but they have not confirmed a reversal. Also, the lower indicator is already almost overbought and could be ready to turn down again. The whole nature of the correction may depend on the ability of the minor cycles to force prices to make a new low.
Cycles
The 13/14-wk high-to-high cycle made its peak last Monday and started a correction.
The minor cycles due to make their lows Tuesday and Wednesday of next week could add pressure to the larger cycle and bring about a new correction low.
Breadth
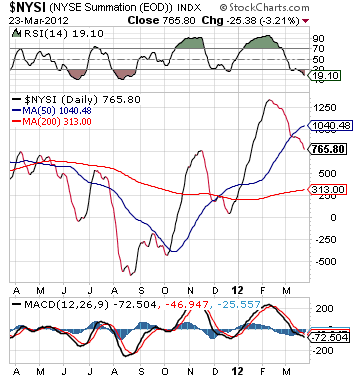
The NYSE Summation Index (courtesy of StockCharts.com) peaked in early February and has been declining ever since. This was at the time when the SPX made its 1378 high. The rally in equities since then has had no effect on the NYSI, causing only a brief hold in the area of its 50-dma, followed by a continuation of its decline. This is tantamount to severe negative divergence at the recent market peak and is bearish.
Both the MACD and RSI have made the same pattern of hesitation before moving lower. However, the RSI is now oversold and could turn up in a matter of days.
Sentiment
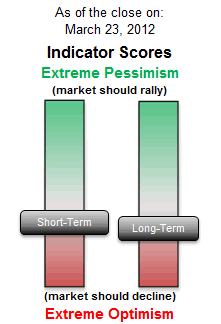
The SentimenTrader (courtesy of same) continues to show a bearish bias, but is not at an extreme reading, which suggests that we should not yet be at an important top.
VIX
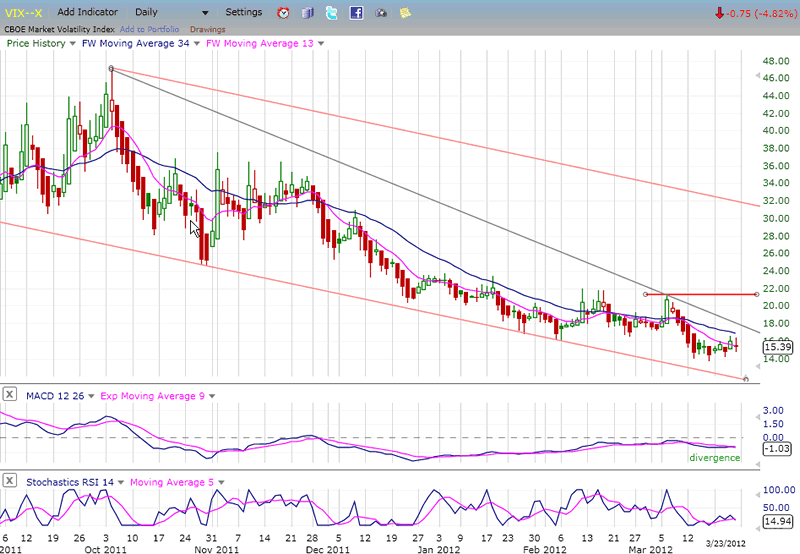
On its daily chart, the VIX started to make a base about two weeks ago, during which it made a new low of 13.66 -- the lowest low since January 2007! If this has any time significance, it would mean that we should not expect a major top for the bull market for quite a while.
Over the near-term, the VIX looks just like any other momentum indicator, but in reverse. A/D, MACD, new Hi/l-Lo all show deceleration and divergence which is indicative of an approaching top. On the Point & Figure chart, the VIX has a base six points across. If it reverses, this means that it has the potential of moving up to 21, the level where it would find resistance caused by the previous short-term high. That could correspond to an interim low in the SPX, followed by some additional consolidation.
That's the potential scenario (emphasis on potential) for a short-term top (emphasis on short-term). The odds of an intermediate top at this time are very low. Most likely, after a consolidation, the SPX should make new highs to 1327 or higher, depending on how much re-accumulation takes place.
XLF (Financial SPDR)
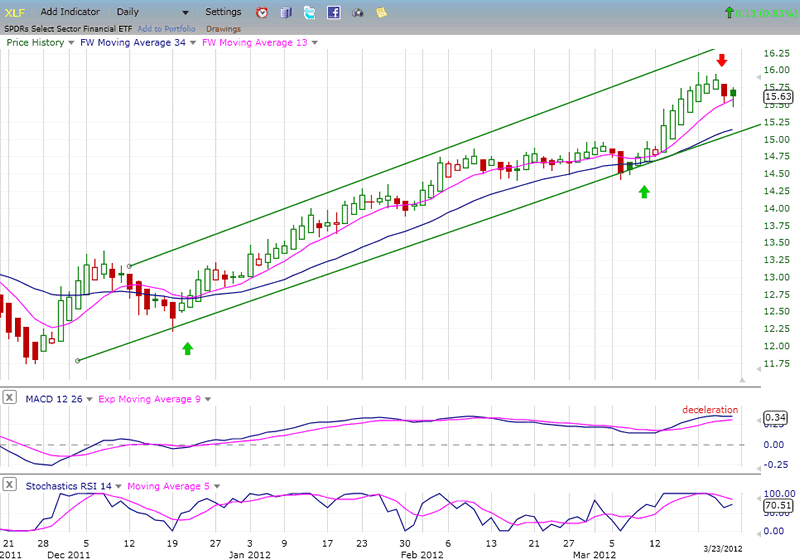
The XLF has a chart pattern which is similar to that of the SPX, but a little stronger. Some weakness will have to develop in this index if we are to have a reversal in the latter. That would mean that the XLF would eventually also have to break out of its channel.
The XLF has a good record of signaling intermediate and long-term tops by showing weakness ahead of the SPX. The fact that it is now a little stronger is an indication that we are not at an important top!
BONDS
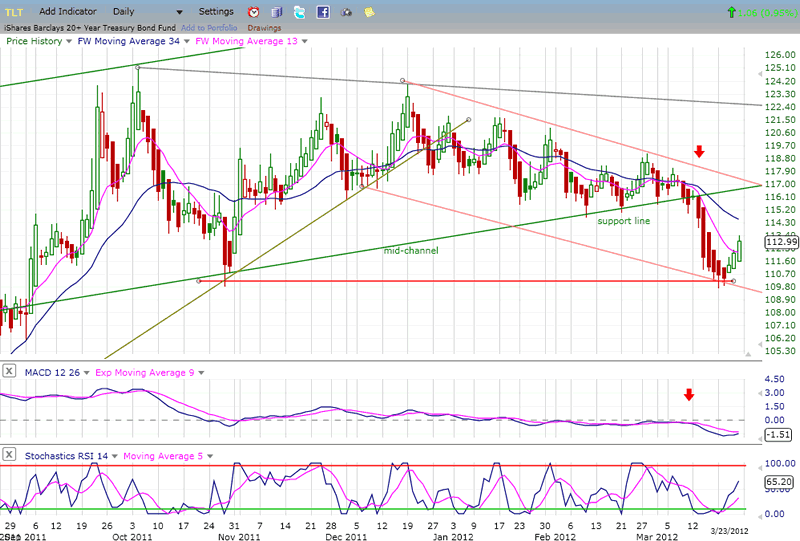
TLT found support where discussed last week. It has bounced off the level created by the short-term low made in November. However, there is no indication that it will stop there. The P&F chart shows a potential for much lower projections. The price looks as if it is making a major distribution pattern which, if fully realized, could take TNT to 88 and lower. Obviously, this would be a long-term target. Short-term, 108 and perhaps 101 is realistic.
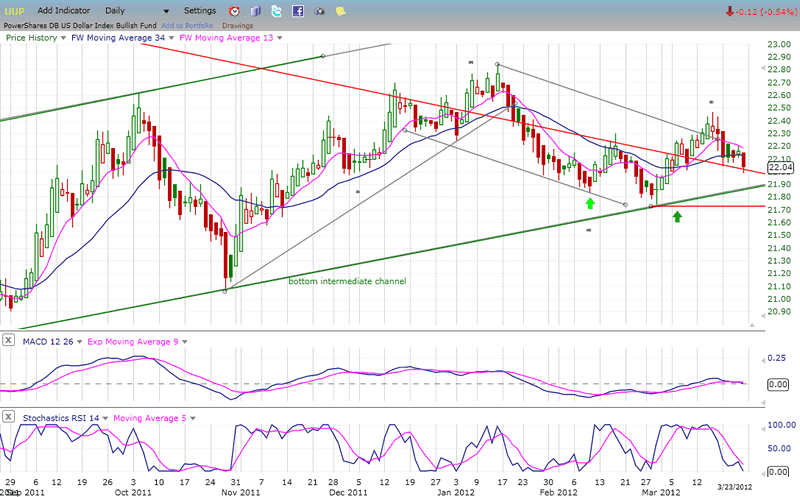
UUP (Dollar ETF) Daily Chart.
After a second attempt at breaking out of its long-term down-channel, UUP needs more consolidation Which could last until the end of the month.
There is a possibility that bonds will stabilize at their current level, and this would probably mean similar action for UUP and the dollar, which may encourage gold buyers to re-appear. We will see next that this is precisely what could happen.
GLD (ETF for gold)
GLD looks as if it could be getting ready for a bounce. If it can hold at this level, it could rise to about 167, and perhaps higher. There is notable downside deceleration in the price movement and the bottom oscillator has already started to rise. There was a projection to about 160 that has been filled, giving the index an opportunity to reverse its downtrend.
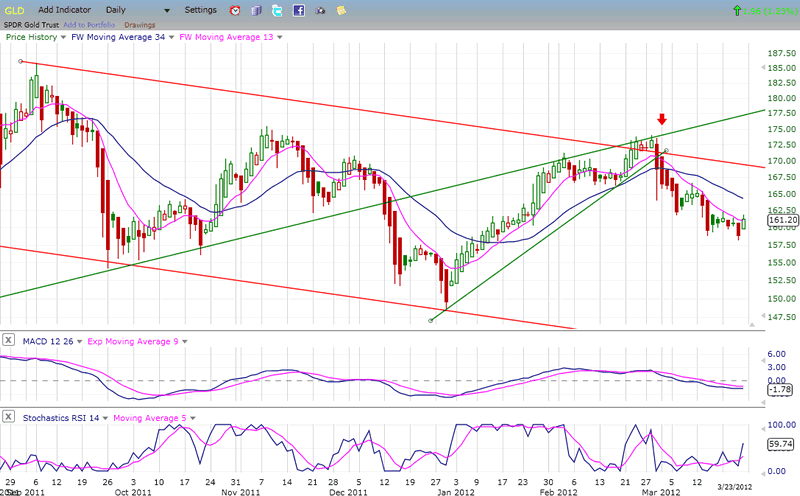
Should GLD break below this level, it could drop another 5 points.
It a rally starts from here, it does not necessarily mean that the index has concluded its intermediate correction and is resuming its long-term uptrend. That would depend on the sustainability of the rally which will have to be evaluated later.
OIL (USO)
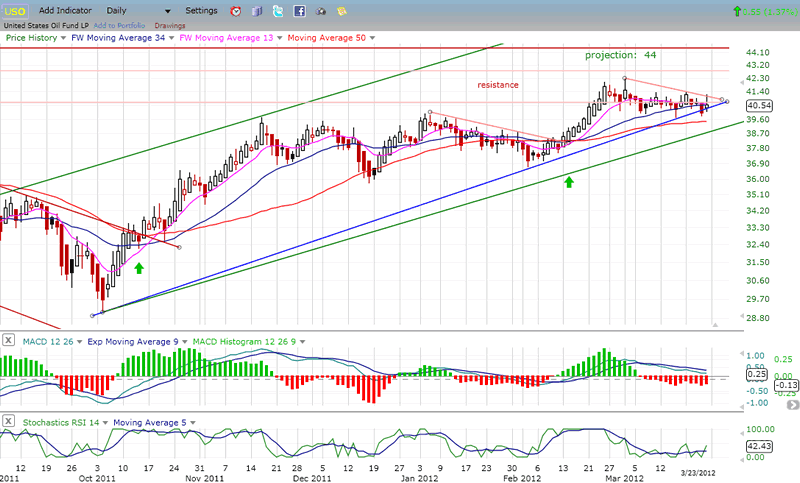
USO is in an intermediate uptrend which has a short-term projection to 44-45 as long as it remains within the confines of its green channel. A break below the blue trend line could modify that count.
The current consolidation of about 4 weeks should end if the minor red trend line is penetrated to the upside. The Stochastic RSI is oversold and has started to turn up. It would have to follow through to indicate that a move toward the projected target is underway.
Summary
Since reaching its interim target of 1414 last week, the SPX has been in a shallow correction. On Friday, it met a minor downside projection to 1386 which coincided with a .382 retracement of the move from 1340.
Early next week, some minor cycles should be bottoming. If they cannot push prices below 1386, there is a chance that the correction will be over, and that the index will be ready to continue its uptrend toward the next target of 1427. Should that happen, if the SPX fails to get past 1414, it would tip the odds to a more extended correction.
FREE TRIAL SUBSCRIPTON
If precision in market timing for all time frames is something which is important to you, you should consider a trial subscription to my service. It is free, and you will have four weeks to evaluate its worth.
For a FREE 4-week trial. Send an email to: ajg@cybertrails.com
For further subscription options, payment plans, and for important general information, I encourage you to visit my website at www.marketurningpoints.com. It contains summaries of my background, my investment and trading strategies and my unique method of intra-day communication with Market Turning Points subscribers.
By Andre Gratian
MarketTurningPoints.com
A market advisory service should be evaluated on the basis of its forecasting accuracy and cost. At $25.00 per month, this service is probably the best all-around value. Two areas of analysis that are unmatched anywhere else -- cycles (from 2.5-wk to 18-years and longer) and accurate, coordinated Point & Figure and Fibonacci projections -- are combined with other methodologies to bring you weekly reports and frequent daily updates.
“By the Law of Periodical Repetition, everything which has happened once must happen again, and again, and again -- and not capriciously, but at regular periods, and each thing in its own period, not another’s, and each obeying its own law … The same Nature which delights in periodical repetition in the sky is the Nature which orders the affairs of the earth. Let us not underrate the value of that hint.” -- Mark Twain
You may also want to visit the Market Turning Points website to familiarize yourself with my philosophy and strategy.www.marketurningpoints.com
Disclaimer - The above comments about the financial markets are based purely on what I consider to be sound technical analysis principles uncompromised by fundamental considerations. They represent my own opinion and are not meant to be construed as trading or investment advice, but are offered as an analytical point of view which might be of interest to those who follow stock market cycles and technical analysis.
Andre Gratian Archive |
© 2005-2022 http://www.MarketOracle.co.uk - The Market Oracle is a FREE Daily Financial Markets Analysis & Forecasting online publication.


