Apple Stock and U.S. Income Inequality
Politics / US Politics Mar 22, 2012 - 01:46 AM GMTBy: EconMatters
 Apple stock price rallied to $602.50 on March 21 partly due to the the company's decision to spread some of its huge pile of cash ($97.6 billion in cash equivalent with no outstanding debt at the end of 2011) in the form of dividend and a share buyback program.
Apple said it will pay a quarterly dividend of $2.65 per share, starting July 1, and plans to buy back up to $10 billion in stock over three years starting Sept. 30. Apple is not the only one hoarding cash. According to Moody's, U.S. corporations, including Apple, has amassed a record $1.24 trillion of cash last year post 2008 credit crisis. Apple has been under pressure to reward shareholders as Apple's iProducts sales keeps feeding its cash mountain. So we most likely will see other large corporations follow suit declaring dividends and initiating share buyback programs in the coming quarters.
However, the more disconcerting question is this:
Given that Apple is the leader in technology innovation and creativity, are these two options (dividend and share buybacks) the best Apple can come up with to put its cash to good use?
After all, Apple shareholders have been rewarded very handsomely as Apple stock soared from a $5+ stock in 1996 to today's $600+ level. Apple stock went up 75% in the past 52 weeks alone. Do Apple stockholders really need more cash reward from Apple?
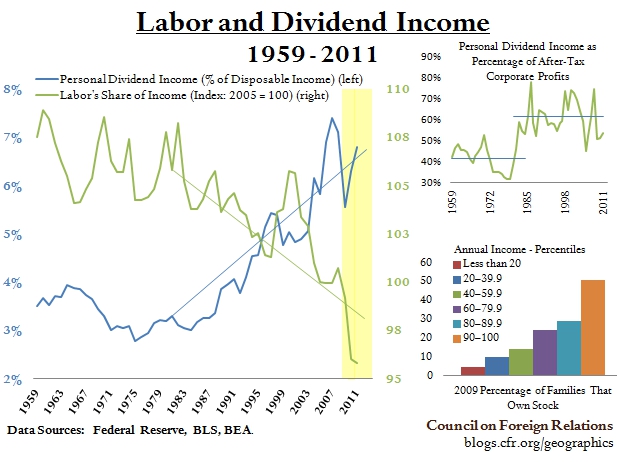
Would Apple not better off re-investing its cash in innovative technology and product R&D, and niche acquisitions? Better yet, how about giving some cash back directly to the employees at Foxconn--Apple's iSweatshop--or Apple's own mid to low levels employees (i.e. non-executive and non-managerial ranks) to boost morale and productivity? After all, Apple owe a large part of its' enviable iSales and iMargins to the hardworking worker bees at Foxconn and Apple. (Yes, we know U.S. corporations are paying wages at the "fair market rate" in oversea shops, but a little cash sprinkle now could go a long way.) The chart below from Council on Foreign Relations (CFR) illustrates how labor’s share of income in the United States has plummeted while personal dividend income as a percentage of disposable income has soared since 2009.

In fact, CFR noted that dividend income along with corporate profits took the biggest jump in the early 1980s, a time in which labor’s share of income has fallen almost continuously. Needless to say, fiscal, legal, and monetary policies enacted by the U.S. government and the Federal Reserve had a big hand in this divergence, as well as growing income inequality in the U.S. How big is the income inequality in the U.S. relative to the rest of the world? Here are some statistics from the Standard Center of Poverty and Inequality:
"The U.S. ranks third among all the advanced economies in the amount of income inequality. The top 1% of Americans control nearly a quarter of all the country's income, the highest share controlled by the top 1% since 1928." Perhaps it is time for corporations to rethink more meaningful and productive long-term strategic use of their cash, instead of driving income gap ever wider to appease the 1%.
By EconMatters
The theory of quantum mechanics and Einstein’s theory of relativity (E=mc2) have taught us that matter (yin) and energy (yang) are inter-related and interdependent. This interconnectness of all things is the essense of the concept “yin-yang”, and Einstein’s fundamental equation: matter equals energy. The same theories may be applied to equities and commodity markets.
All things within the markets and macro-economy undergo constant change and transformation, and everything is interconnected. That’s why here at Economic Forecasts & Opinions, we focus on identifying the fundamental theories of cause and effect in the markets to help you achieve a great continuum of portfolio yin-yang equilibrium.
That's why, with a team of analysts, we at EconMatters focus on identifying the fundamental theories of cause and effect in the financial markets that matters to your portfolio.
© 2012 Copyright EconMatters - All Rights Reserved Disclaimer: The above is a matter of opinion provided for general information purposes only and is not intended as investment advice. Information and analysis above are derived from sources and utilising methods believed to be reliable, but we cannot accept responsibility for any losses you may incur as a result of this analysis. Individuals should consult with their personal financial advisors.
© 2005-2022 http://www.MarketOracle.co.uk - The Market Oracle is a FREE Daily Financial Markets Analysis & Forecasting online publication.


