Massive Silver Price Spike Imminent
Commodities / Gold and Silver 2012 Mar 20, 2012 - 12:41 PM GMTBy: Hubert_Moolman
 Gold and silver are very close to entering the mania phase of this bull market. In order for gold and silver to go into the mania phase, value has to be diverted from somewhere, and that “somewhere” is most likely stocks. Since 2000, there has been a correction in stock values, in real terms; however, nominally, stocks are still significantly high (close to its all-time highs).
I expect that significant value will soon be diverted from the general stock market, to silver and gold, causing prices to rally significantly, until these metals also become overvalued.
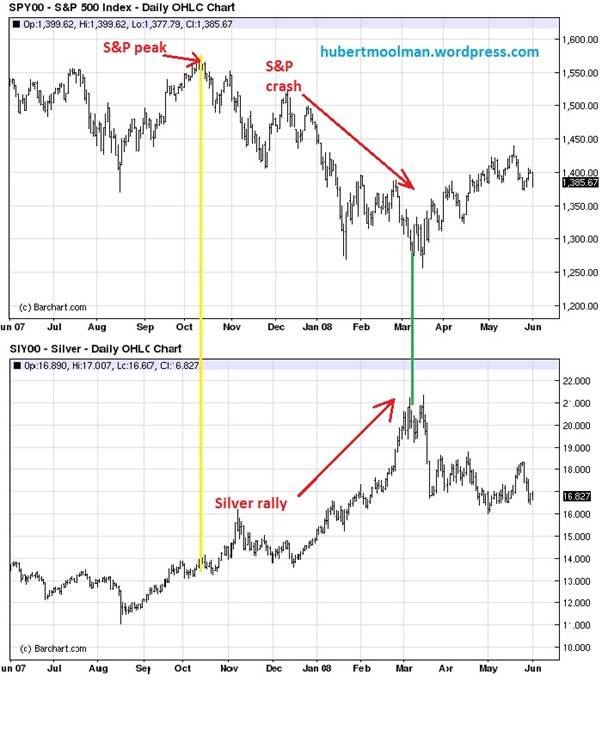
This is exactly what happened in 2007/2008. Below is a graphic (charts from barchart.com) that illustrates how this happened in 2007/2008:

The top chart is for the S&P 500 and the bottom is for silver. I have drawn a yellow line, at the point where the S&P 500 peaked. It is only after the peak in the S&P 500 that silver broke out, and eventually rallied significantly (while the S&P 500 was crashing). From a “fractal” point of view, we are currently in a similar position, with stocks getting ready to peak.
Silver Fractal Analysis
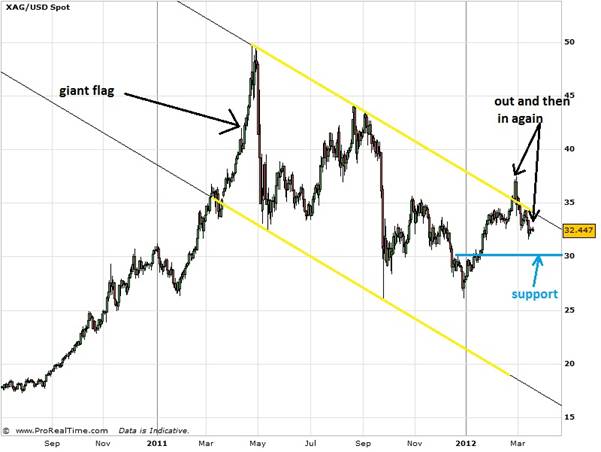
Silver has made its way out of the giant flag; however, it fell back again, lower than the upper boundary of the flag, as shown in the following chart:

Previously, I have stated that price will eventually break out of the flag and go on to make much higher highs. Below, is some evidence to support this view:

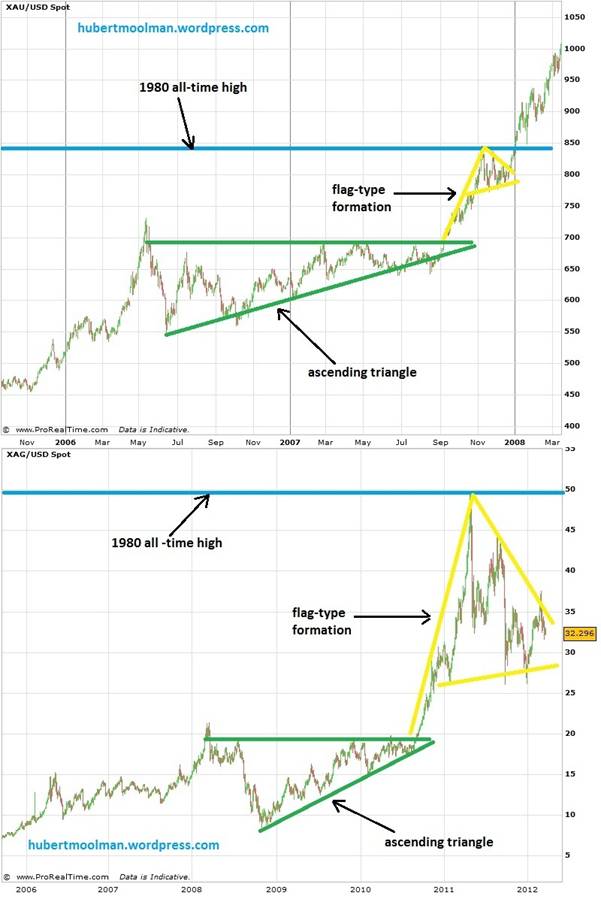
The top chart is for gold and the bottom one is for silver. Gold and silver made similar patterns before and after reaching their respective 1980 highs. From the charts, you can see there is a similarity in how gold and silver approached their 1980 high. Both made a triangle-type pattern (green lines) just before it reached the 1980 all-time high. When it came out of that triangle pattern, it rallied strongly to the 1980 high, which started the formation of a flag-type pattern (yellow lines).
Gold passed its 1980 all-time high during 2008, while silver is yet to do so. By looking at the pattern of how gold passed its 1980 high, we can predict how silver might do it as well. If silver continues to follow the pattern that gold formed, then we can expect a massive spike towards the $50 and beyond, very soon. Read my previous article for more about this comparison.
For more detailed analysis of gold, silver and the Dow, you are welcome to subscribe to my free or premium service.
Warm regards and God bless,
Hubert
http://hubertmoolman.wordpress.com/
You can email any comments to hubert@hgmandassociates.co.za
© 2012 Copyright Hubert Moolman - All Rights Reserved
Disclaimer: The above is a matter of opinion provided for general information purposes only and is not intended as investment advice. Information and analysis above are derived from sources and utilising methods believed to be reliable, but we cannot accept responsibility for any losses you may incur as a result of this analysis. Individuals should consult with their personal financial advisors.
© 2005-2022 http://www.MarketOracle.co.uk - The Market Oracle is a FREE Daily Financial Markets Analysis & Forecasting online publication.


