Forex, Metals and Stock Market Outlook for the Week Ahead
Stock-Markets / Financial Markets 2012 Mar 19, 2012 - 12:59 AM GMTBy: Chad_Bennis
 The markets this week saw lots of movement with rallies in the dollar, equities went to new highs and metals drifted lower throughout last week. With all the optimism in the global economic outlook let’s have a look at what the charts are saying and what next week may hold concerning these markets.
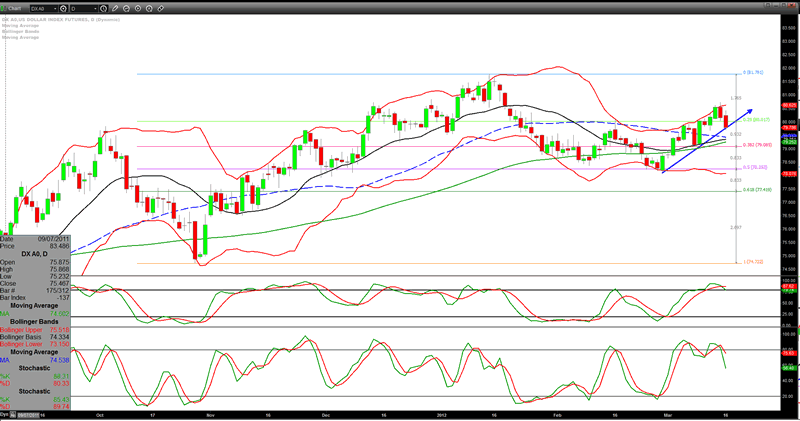
The US dollar rallied early last week and pushed the index into new intermediate highs, but by Thursday the bears overtook the index and pushed the price lower. The dollar is now sitting on its uptrend line and is short term oversold. The dollar needs to stabilize here and begin to rally or downside target points to the 79 handle. Currently, the momentum is starting to turn upwards, but the dollar will need to clear 82 to strengthen this upward trend. If the dollar can clear the 82 handle to the upside then their is a chance the dollar could continue to rally into the high 80′s before the next round of selling takes place. Here is the daily chart.
The dollar is receiving lots of popular press as it has been the stronger player in the currency markets, but behind the scenes an altogether different story is playing out. The IMF’s Christine Lagarde had this to say:
Lagarde’s comments on the yuan as a reserve currency were the most direct endorsement to date by an IMF official of China’s ambitions for its currency.
“What is needed is a roadmap with a stronger and more flexible exchange rate, more effective liquidity and monetary management, with higher quality supervision and regulation, with a more well-developed financial market, with flexible deposit and lending rates, and finally with the opening up of the capital account,” she told a gathering of leading Chinese policymakers and global business leaders.
“If all that happens, there is no reason why the renminbi will not reach the status of a reserve currency occupying a position on par with China’s economic status.”
Lagarde’s statement above is painting the picture that the yuan may and is becoming the reserve currency of the world. This rally in the dollar will surely be met by strong dollar holders selling their US dollars into this rally as they have to be well aware of the shift away from the US dollar being the only internationally recognized currency for global trade. Plus, with all the debt the US has accrued over the past decade it is mathematically impossible to pay it all off with a gdp of roughly 2-3% and a strong dollar. The dollar needs to weaken dramatically for the debt of the US to be paid off and this strategy is in line with Bernanke’s target to weaken the US currency by 30% over the coming years according to his own statement.
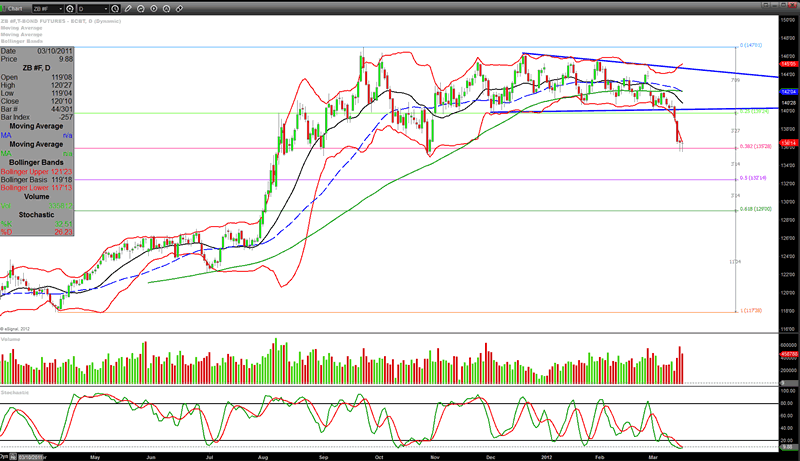
The bond market this week saw a massive sell off after the FOMC meeting. It dropped right down to its first fibonacci support line and held there the latter half of last week. It is very overstretched to the downside and may bounce early in the week, but I expect it to be met with sellers on any rally in the short term. If 135 fails to hold then expect 132 to be in the crosshairs of most traders. An announcement of QE would surely send the bonds higher, but with operation twist coming to an end in June the bond market may continue its sell off once the Fed stops purchasing its own debt. This sell off in bonds has freed up some cash for investment. The question remains, where is this capital headed? This week has the potential to see continued inflow of capital from the bond market into the equity markets. Here is the daily chart.
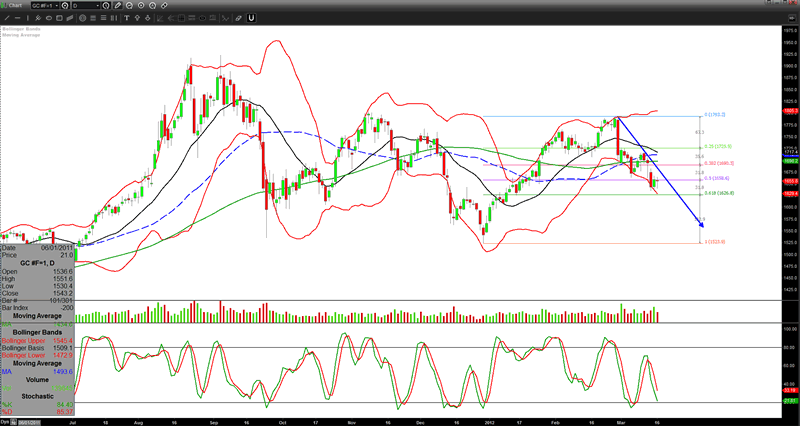
Gold saw a strong sell off this week after the FOMC meeting. The move upwards from December’s lows has seen a consistent sell off for the past few weeks. The price is approaching the 61.8% retracement level. This support is at the 1626 level. Gold’s corrections from strong uptrends tend to find stability at the 61.8% level going back the last decade. It will be interesting to see if gold can find support at this level. The downtrend in gold is still currently intact and price needs to find some stability this week for a relief rally to ensue.
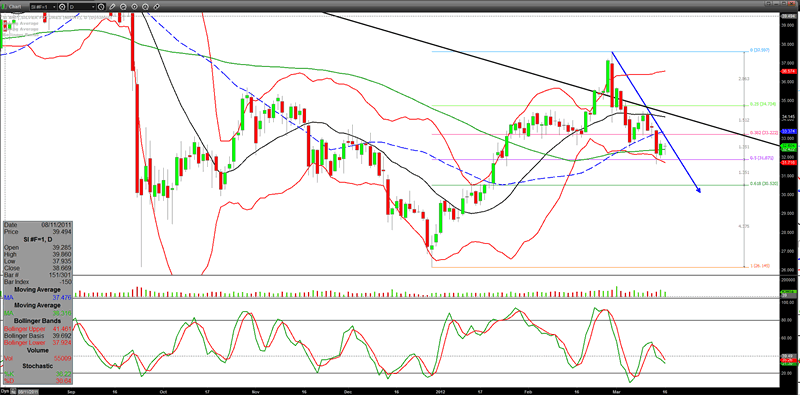
Silver is in the same boat as gold, but is currently being supported by the 50% retracement level in the $31.87 area. If this support fails then expect prices to fall lower to the $30.52 area. There is the possibility if silver, and gold for that matter, find support early in the week then there is a bullish divergence forming in the charts with prices making lower lows while the stochastic is making a higher high. This may mean that a reversal is at hand and could push prices back into former resistance areas.
The equity markets this week saw some fresh new territory as the nasdaq passed the 3,000 level not seen since 2000. The S&P bested its pre-crash level by pushing past 1,400 and the dow is on track to revisit its pre-crash high of 14,000.
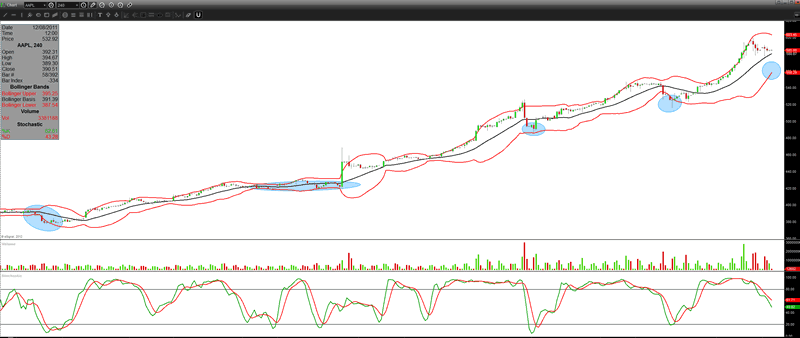
The nasdaq is being fueled by a monster rally in Apple, Inc. This week pundits and analysts are calling for upwards of $700-$900 for Apple’s stock. It is starting to sound bubbly as prices have been heading straight up for some time. That being said, there is no reason that Apple couldn’t continue straight up into early summer before someone rings the cash register and the stock corrects. If one believes in the Apple rally then there may be an opportunity to get long the stock going forward. The 4 hour chart has shown some great buying opportunities that have consistently held throughout its month’s long march to higher levels. The 4 hour chart shown below has 4 buy areas circled in blue. Each time the price has sought the support of the lower bollinger band with an oversold stochastic the price has found support and rallied higher. This puts the next buy area roughly in the $558 area. If this level holds and a rally ensues then $700 may be the next target for Apple’s journey.
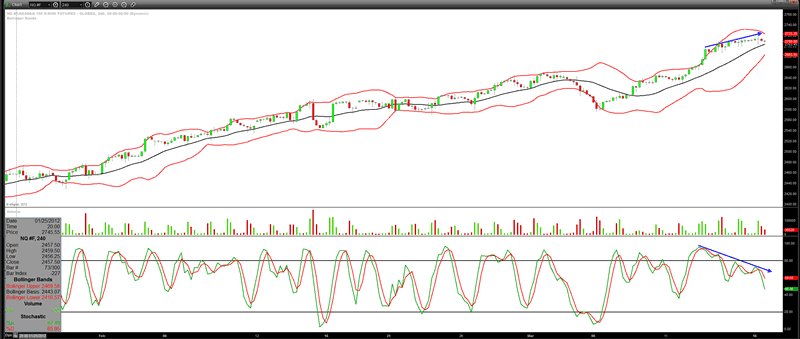
The nasdaq itself is making tremendous gains as it has its sights set on the highs made in the tech bubble. With the 3,000 level breached the index has its sight set on new highs in the coming weeks. Is it time to buy? Looking at the 4 hour chart of the nasdaq 100 futures the current rally is showing signs of weakness as each push higher is running out of momentum and may correct lower to discover if there are willing buyers ready to buy and take this index to new highs in the coming months. Below is the 4 hour chart showing bearish divergence as the price made higher highs while the stochastic made lower highs. This bearish divergence points to some weakness at these high prices and buyers should wait for a short term correction before nibbling away at the long side of this spectacular uptrend.
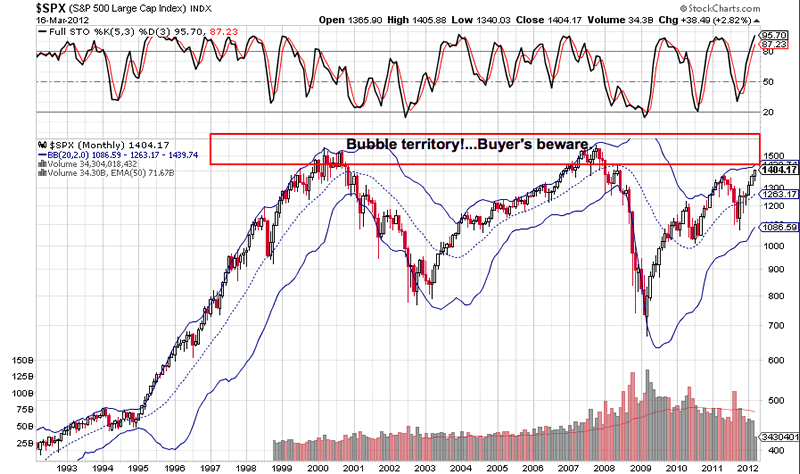
The S&P passed the 1,400 level this week which is a huge win for the bulls, but looking back at the monthly chart over the last 20 years one has to be tentative going forward. The S&P has witnessed huge sell offs each time the index has pushed above 1,400. Will this time be different? Time will tell, but it is hard to believe with today’s faltering economy compared to 1999 and 2007 that the current rally has any fundamental legs underneath it outside of cheap money from the Fed’s printing press. Here is the monthly chart going back 20 years.
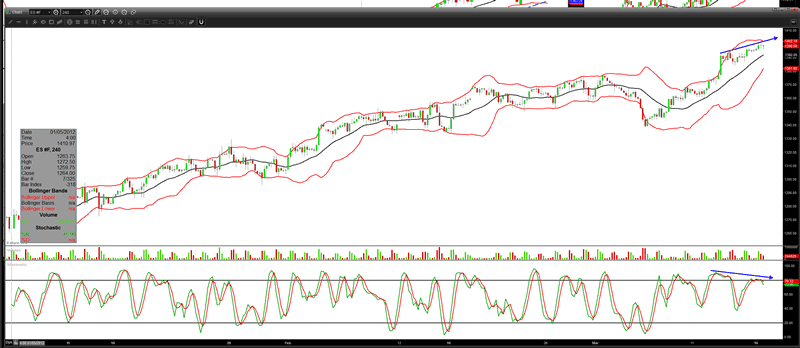
The 4 hour chart of the S&P future’s shows the same underlying exhaustion that the nasdaq 100 portrayed. Bulls in this index should wait for a short term correction before jumping in with both feet. The chart shows bearish divergence in the price action and should correct lower to work off some of this overbought condition sometime next week.
This next week will be very telling in what the next few months hold, but accepting strength in the current market’s trends one should expect the equity markets to remain strong, the bond market to be sold into on any rally and the metals to find support and begin basing out at the current levels.
Happy trading next week!
CA Bennis
www.wheatcorncattlepigs.com
© 2012 Copyright CA Bennis - All Rights Reserved
Disclaimer: The above is a matter of opinion provided for general information purposes only and is not intended as investment advice. Information and analysis above are derived from sources and utilising methods believed to be reliable, but we cannot accept responsibility for any losses you may incur as a result of this analysis. Individuals should consult with their personal financial advisors.
© 2005-2022 http://www.MarketOracle.co.uk - The Market Oracle is a FREE Daily Financial Markets Analysis & Forecasting online publication.


