Is Copper Signaling Lower Gold Prices Ahead?
Commodities / Gold & Silver Jan 14, 2008 - 09:37 AM GMTBy: Clif_Droke
 Here's a question many investors have asked in recent weeks, especially given the current divergence between the gold and copper prices.
Copper has a history of providing leading signals for the price of gold. Most notably, the copper price double-bottomed between 1999-2001 and refused to make a lower low during a time when the price of gold make a 20-year low. This leading signal in copper preceded the major turnaround in the yellow metal price in 2002 and beyond.
For years I've relied on the proxy of Freeport Copper & Gold (FCX) as a leading/confirming indicator for the XAU gold/silver mining index. It's true that the copper producers have historically led the gold mining stocks at pivotal turning points in short-, intermediate- and even long-term time frames. This appears to be one area of mining sector research in need of greater attention.
With this question of copper vs. gold leadership in mind, let's take a look back in recent history in search of a potential connection between the two. We'll start by looking at a major blue chip copper stock, Southern Copper Corp.
Southern Copper Corporation produces copper, molybdenum, zinc, and silver. The company, formerly known as Southern Peru Copper Corporation, was founded in 1952 and is based in Phoenix, Arizona. Southern Copper is a subsidiary of Americas Mining Corporation. The stock, which trades under the symbol PCU on the NYSE, has long been a leading indicator of the XAU gold/silver index as a comparative analysis of both charts will show.
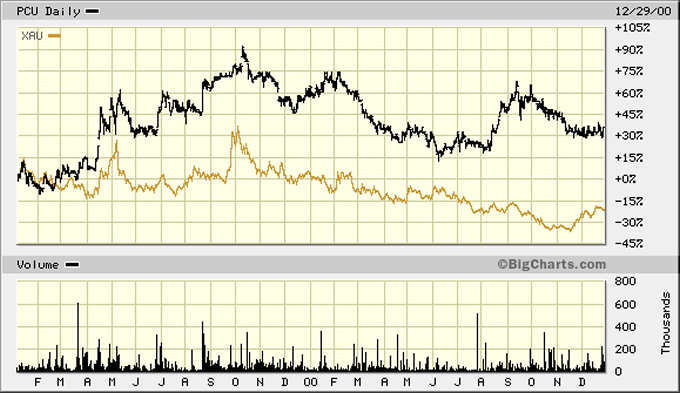
In late 1999 when the Kress 30-year cycle for equities peaked, the gold stock group as represented by the XAU also suffered from the broad market selling pressure. The XAU made an interim peak in October 1999 along with PCU. The XAU was the first to peak out and from there the XAU entered a downward trend, making a series of lower highs and lowers lows throughout the year 2000. The XAU finally hit bottom in October 2000 – exactly one year after its peak.
During 1999-2000, PCU made a higher low against the XAU index. While the XAU broke below its 1999 low, PCU stayed above its low from ‘99 and made a conspicuously positive divergence against the XAU. This was the first intermediate-term technical signal that the gold stocks were due a reversal and it turned out to be prescient. The XAU embarked on an 18-month rally off its October 2000 low at the 43 level to its high just below 90 in May 2002.

By the time the XAU made its multi-year high at the 90 level in May 2002, PCU failed to make a higher high. This was an intermediate-term negative divergence and it predicted a period of weakness ahead for the gold stocks. Not surprisingly, the XAU entered a period of underperformance relative to the broad market as it pulled back from its May '02 high and entered a 14-month trading range between the 60 and 80 levels.
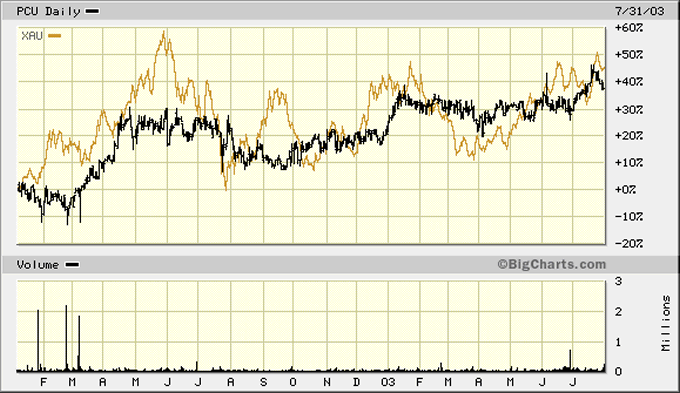
The XAU finally broke out above 80 in July 2003, but not before another leading signal from PCU. PCU broke out to a higher high in January 2003 at the same time the XAU was making a lower high below its May 2002 peak. The breakout made by PCU in January 2003 was the signal that the major trend for the mining sector was up, notwithstanding the interim weakness in the XAU index. Within five months of this leading signal from PCU, the XAU broke out of its interim trading range and was on its way to higher levels in 2003.

After a vigorous rally in the second half of 2003, the XAU made a double top between December 2003 and January 2004. This led into a long period of underperformance versus the S&P as the XAU experienced a rather large trading range in 2004 which stretched from the 80 level to the 110 level. The XAU closed with a loss for 2004, yet PCU made a higher high in October 2004 which signaled that a period of strength was just ahead for the gold stocks.
After overcoming a shaky start to the New Year in 2005, the XAU recovered to make a higher high in 2005. True to form, PCU had led the way higher for the gold stock group once again.
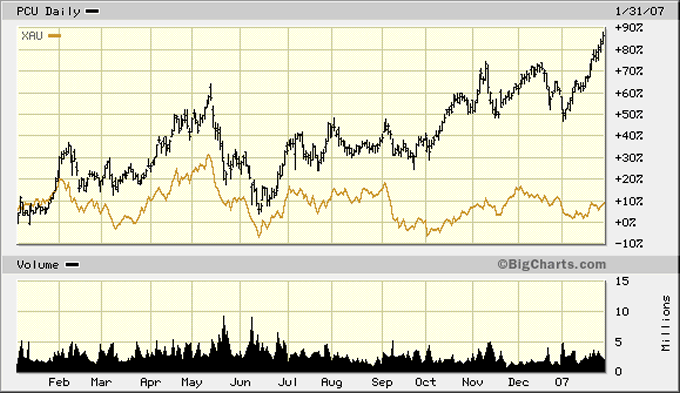
In May 2006 the XAU encountered resistance and there followed another period of underperformance as the XAU spent the better part of the period between May and December '06 in a narrow trading range between the 120 and 150 levels. While the XAU closed the year 2006 below its high from May of that year, how did PCU fare? The stock managed to close 2006 on a high note after making a series of higher highs and higher lows throughout that year. This was yet another leading indicator that the XAU would eventually succeed in breaking out of its interim trading range and travel to higher levels.

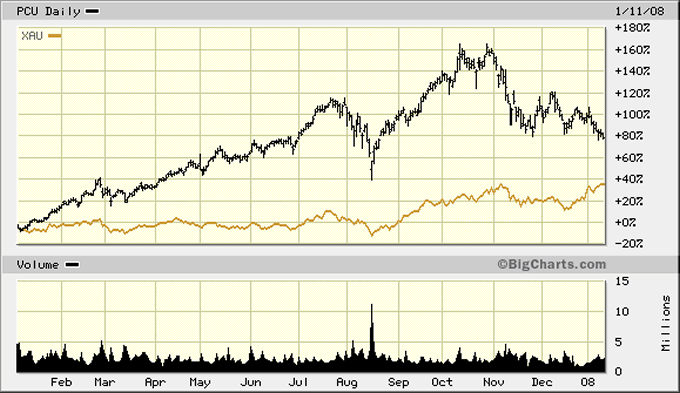
The anticipated breakout in the XAU didn't occur until July 2007. It was followed by a whipsaw-type pullback in August '07. At the August 2007 low the call/put open interest ratio for the CBOE Gold Index reached an extraordinary level which strongly suggested that insiders were heavily long the gold stocks. This proved to be an accurate indicator as the XAU roared ahead from the August low into November of that year to a new all-time high, covering a ground of nearly 75 points from bottom to top. After a brief but shallow correction in November-December, the XAU recovered its old high and made a slightly higher on Jan. 11, 2008.
Up until the November 2007 high in the XAU, the PCU price line was confirming the bull market in the gold stocks. Since November '07, however, PCU has pulled back and retraced some of its previous gains and is now at its lowest close (as of January 11, 2008) since August 2007. PCU has been lagging the XAU for the past two-and-a-half months. Is this a concern for the gold stocks?

The lag between the upside breakout to new highs in PCU in November 2006 and the XAU's eventual breakout in the summer of 2007 was obviously a lot longer than the historical norm. It's possible that the gold stocks will overcompensate for this long lag by continuing to surge upward in the weeks ahead even if PCU and the other leading copper stocks continue to underperform. At some point, though, a continued lag between copper and gold, and the copper and gold mining stocks, will reach the break point and the yellow metal, along with the PM stocks, will give way to the negative undercurrent.
Much of the current strength reflected in gold and the leading gold stocks is due to the fear premium as investors run for cover from the widespread fears over the economy. Gold has greatly benefited from its safe haven status during this time of investor uncertainty. When the fear has finally lifted, however, the fear premium will no longer be in the yellow metal's favor. The “heads up” signal in such equities as PCU, FCX, IMN:TSX and TCK seem to be warning of this intermediate-term eventuality.
By Clif Droke
www.clifdroke.com
Clif Droke is editor of the daily Durban Deep/XAU Report which covers South African, U.S. and Canadian gold and silver mining equities and forecasts PM trends, short- and intermediate-term, using unique proprietary analytical methods and internal momentum analysis. He is also the author of numerous books, including "Stock Trading with Moving Averages." For more information visit www.clifdroke.com
Clif Droke Archive |
© 2005-2022 http://www.MarketOracle.co.uk - The Market Oracle is a FREE Daily Financial Markets Analysis & Forecasting online publication.


