


Stock Market Indicators Becoming Bullish
Stock-Markets / Cycles Analysis Jan 14, 2008 - 09:22 AM GMTBy: Andre_Gratian

 Current position of the Market
SPX: Long-term trend - Election years that fall in the 8th year of the Decennial pattern call for
consolidation in the early part of the year followed by a strong finish. But the 6-yr cycle which
is scheduled to bottom in late Summer/early Fall could play a restraining role, followed by an
eventual bull market top in 2009-2010.
SPX: Intermediate trend - an extended intermediate-term consolidation is in process.
Analysis of the short-term trend is done on a daily basis with the help of hourly charts. It is an important adjunct to the analysis of daily and weekly charts which determines the course of longer market trends.
Daily market analysis of the short term trend is reserved for subscribers. If you would like to sign up for a FREE 4-week trial period of daily comments, please let me know at ajg@cybertrails.com .
Overview
The big news this past week (to technicians, at least) was that the SPX broke out of its uptrend line from 2003 and closed fractionally below it. How significant was this? Perhaps not too! The indices have had a big run-up since 2003 and they are entitled to a correction. Besides, as you will see on the weekly chart below, there is another very important trend line which is still intact, and the index is still trading within the confines of its long term up-channel.
We are going through a period of uncertainty about the economy, whether or not a recession lies ahead, and if the Fed will be able or prevent it. The market is reflecting this uncertainty by making what appears to be an extended corrective pattern. By breaking below its former short-term low of 1406 it is technically in a corrective wave of intermediate proportion. Until then, the index was making a pattern of higher lows. Last week, this changed with the former low being broken.
If we go by the decennial pattern of the past 100+ years, we should expect to continue this intermediate correction until about May -- this according to the seasonal pattern of election years ending in 8 whose chart I posted in the last newsletter. Although this year, its low could come earlier in March in conjunction with an important intermediate cycle.
As we will see, there are many signs suggesting that we could be in the process of making an important short-term low, but to get back into an intermediate and long-term uptrend, we would need to rise above 1523. This is not likely to take place in the next rally, and so another decline into March for a potential end to the current intermediate correction makes more sense.
What's ahead?
Momentum:
The downside momentum appears to be stabilizing with the low of the 20-wk cycle which apparently bottomed last week and, as we will see, there are indications that a short-term uptrend may be developing. Let's look at the daily chart of the SPX.
Notice that we are now in a well-defined down-channel consisting of two short-term waves. It is likely that the second wave is complete if the 20-wk cycle did make its low last week, but we won't know until next week because neither indicator at the bottom of the chart has given a short-term buy signal, and Friday's action was inconclusive. The index was either in the process of testing Wednesday's low or getting ready to make a final low for the second wave.
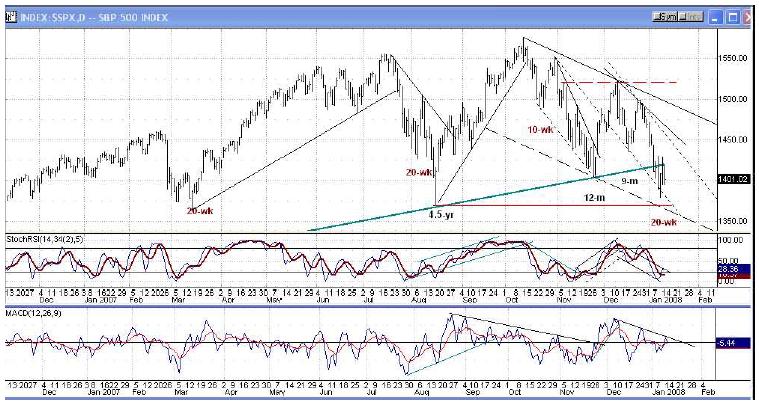
The price failed to go all the way to the bottom of its channel -- a sign of deceleration, and the bottom A/D oscillator now has a strong pattern of positive divergence to the price. Since both of these reflect a lesser degree of selling pressure (which is consistent with a low) and that we are in the time window for the 20-wk to have made its low, we have to assume that the odds favor that prospect. But this will not be confirmed until both oscillators break through their downtrend line as prices reverse and continue past 1431.
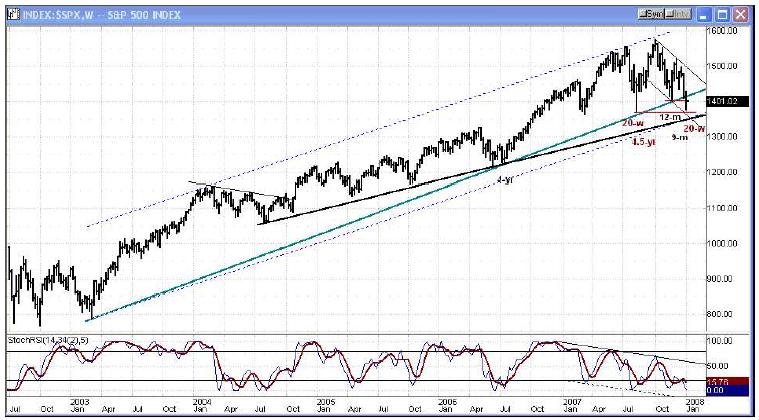
Now, let's take a look at the weekly chart. The blue dotted lines represent the long-term uptrend channel, the green line the trend line from March 2003, and the black trend line the long-term uptrend since the 10-yr cycle low in 2004. Only one trend line has been penetrated so far, and the other two are intact. Not too much to get excited about for the moment. Perhaps this will help us understand the growing bullishness of other indicators that will be discussed later.
Note also that the momentum indicator at the bottom is very oversold, but not yet ready to turn up. This also puts the intermediate trend correction in perspective, and suggests that it has longer to go.
Cycles
Cyclically, the 20-wk cycle should have made a higher low and the SPX should be continuing its uptrend, but last week it broke below the 9-mo and 12-mo lows, and is close to doing the same to the 4.5-yr bottom. This means that there are larger cyclical influences at work here. One is the seasonality of a presidential election which falls during the 8th year of the decennial pattern, and the other is the 6-yr cycle which is due to make it low in late Summer or early Fall.
We could argue that although cycles influence investor psychology, so do a number of other factors and when they conflict with cyclicality, this influence is either diminished or nullified. There are certainly plenty of other factors, principally economic, which have a bearish influence on investors today. But since we have cyclical reasons for the market's behavior, who is to say that these are not the principal influences?
Fortunately, it does not really matter which is the egg and which is the chicken. We have other tools to forecast the market. But we should keep in mind that the seasonality pattern ends in the first part of the year and is followed by a strong finish. So we could be looking for a low to this correction in March, in connection with the Hurst 9-mo cycle low which, incidentally, corresponds with an important date in the Martin Armstrong 8.6-yr business cycle calendar. And if the market does not produce a strong uptrend at that time, we may have to wait a few more months for the 6-yr cycle bottom to resume the bull market.
Projections:
When the SPX reached 1498, it only managed to reach half of a 2-phase Point & Figure base projection before, once again, showing significant weakness. By breaking below its former 1436 low, it triggered a Fibonacci target to about 1380 which was confirmed by a P&F count. This is an excerpt from Wednesday's morning Comment to subscribers:
----- Original Message -----
From: Andre Gratian
Sent: Wednesday, January 09, 2008 7:24 AM
Subject: Morning Comment
A number of downside projections have been generated with yesterday's action. Best shortterm target is about 1480. I will discuss the longer-term ones later on.
The rally from 1380 stopped just shy of 1431, which needed to be surpassed to confirm that we were in a new uptrend. But Friday's action was more characteristic of a test of the 1380 low than the beginning of another decline. If this is so, it will establish an important base pattern that should take us at the very least to 1450, and perhaps higher. Some of the indicators are suggesting that a fairly significant uptrend may be about to develop.
The decline from Thursday's high of 1429 may have reached its low, or could go slightly lower to 1390.
Breadth
First, I will repeat what I wrote 2 weeks ago, then show you an updated version of the Summation Index and comment on it.
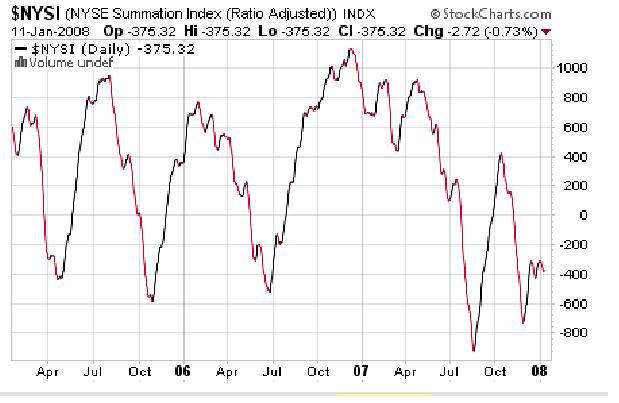
Examining the relationship of breadth to price is one of the most important means of determining market health. One way to analyze the intermediate-term breadth pattern is with the help of the McClellan Summation Index of the NYSE McClellan oscillator. The following is a reproduction of the Summation Index for the past 3 years (courtesy of StockCharts). Note that it has tended to fluctuate in a range from overbought to oversold. It is currently oversold by recent bull market standards, but it could reach far deeper levels of negativity in a bear market.
There is only one thing to note on this graph, but it could be extremely significant; a pattern or positive divergence is now developing on this intermediate A/D indicator. It barely budged in the past two weeks while the market was making new lows. Now, look back at the A/D oscillator on the above daily chart of the SPX, and you can see why this happened.
This suggests that we may be making a fairly important low on this index which may turn out to be a prelude to an intermediate-term buy signal.
Market Leaders and Sentiment
Starting with the NDX/SPX relationship, the weekly pattern is bullish, but the daily pattern has weakened, suggesting that we may not be done with the intermediate correction, and we are not ready to go immediately to a new high. GE/SPX is bearish.
In the sentiment indicators, the ISEE is telling us that we are at a low, and so is the AAII index. The TRIN is giving a bullish reading, and so is the VIX which is showing positive divergence from the SPX.
Finally, next to their August reading, the Insiders Buying Index for December has the second most bullish reading for 2007, the first one being August which saw the 4.5-yr cycle low.
None of these indices give a precise market turn date. For this, one must rely on more time- sensitive indicators.
Summary
While the market has declined to new lows in the past two weeks, reliable indicators have become more bullish. But some suggest that a little more time may be necessary before an intermediate low is made.
The EW structural pattern which potentially called for an intermediate low at this time has evolved into another pattern and is no longer valid, signaling that the correction is likely to extend for a few more weeks. However, this extension could come as a basically sideways pattern, and not necessarily as a decline to much lower levels.
The McClellan Summation Index is beginning to develop bullish divergence.
The following are examples of unsolicited subscriber comments:
What is most impressive about your service is that you provide constant communication with your subscribers. I would highly recommend your service to traders. D.A.
Andre, You did it again! Like reading the book before watching the movie! B.F.
I would like to thank you so much for all your updates / newsletters. as i am mostly a short-term trader, your work has been so helpful to me as i know exactly when to get in and out of positions. i am so glad i decided to subscribe to turning points. that was one of the best things i did ! please rest assured i shall continue being with turning points for a long while to come. thanks once again ! D.P.
But don't take their word for it! Find out for yourself with a FREE 4-week trial. Send an email to ajg@cybertrails.com .
By Andre Gratian
MarketTurningPoints.com
A market advisory service should be evaluated on the basis of its forecasting accuracy and cost. At $25.00 per month, this service is probably the best all-around value. Two areas of analysis that are unmatched anywhere else -- cycles (from 2.5-wk to 18-years and longer) and accurate, coordinated Point & Figure and Fibonacci projections -- are combined with other methodologies to bring you weekly reports and frequent daily updates.
“By the Law of Periodical Repetition, everything which has happened once must happen again, and again, and again -- and not capriciously, but at regular periods, and each thing in its own period, not another’s, and each obeying its own law … The same Nature which delights in periodical repetition in the sky is the Nature which orders the affairs of the earth. Let us not underrate the value of that hint.” -- Mark Twain
You may also want to visit the Market Turning Points website to familiarize yourself with my philosophy and strategy.www.marketurningpoints.com
Disclaimer - The above comments about the financial markets are based purely on what I consider to be sound technical analysis principles uncompromised by fundamental considerations. They represent my own opinion and are not meant to be construed as trading or investment advice, but are offered as an analytical point of view which might be of interest to those who follow stock market cycles and technical analysis.
Andre Gratian Archive |
© 2005-2022 http://www.MarketOracle.co.uk - The Market Oracle is a FREE Daily Financial Markets Analysis & Forecasting online publication.