


Energy Sector Stunning Demand and Production Trends & Developments
Commodities / Energy Resources Jan 13, 2008 - 08:17 AM GMTBy: Joseph_Dancy

 While we did not see triple digit crude oil prices in the futures market last year we remain optimistic the energy sector will perform well in 2008. Growing global energy demands will continue to present challenges to the market.
Several graphics we ran across last month illustrate the major issues in the energy sector. The chart at right from an article in the Financial Times illustrates that the use of fossil fuels has correlated very closely with economic growth over the last 185 years.
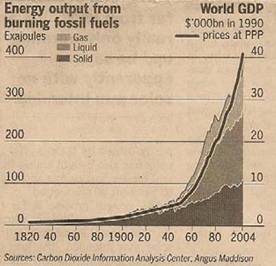 Global growth in 2007 is expected to reach 4.6%. Much of the growth was centered in economies that are not very energy efficient per unit of economic growth. With global economic growth continuing into 2008 we expect energy use will continue to expand at a rapid clip.
Greenhouse gas emissions also correlate closely with the demand for fossil fuels – which raises some interesting problems for those trying to limit emissions. Unless new technology is developed, reducing emissions will require the use of less fossil fuels – which will make growing the global economy much more difficult.
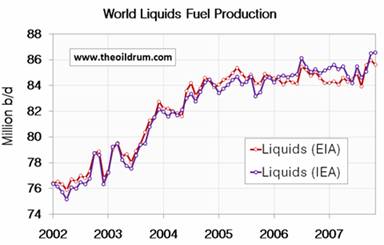
While global demand for fossil fuels continues to grow with economic growth, the growth in production of crude oil liquids has flattened a bit over the last few years at around 86 million barrels per day (see chart at left, courtesy of the Oil Drum).
In light of the production chart keep in mind the International Energy Agency (IEA) increased its forecast for global oil demand last month. It now forecasts total demand of 87.8 million barrels per day in 2008, mainly due to increased demand from emerging economies.
Crude oil, and natural gas liquids, play a major role in the global energy equation. The transportation sector generates most of the demand for the liquid fuel products, and global transportation needs continue to increase with living standards. Most striking is the growth of transportation demand in China – in 2007 auto sales are expected to increase 20% to 8.7 million units, a sales level that trails only the U.S.
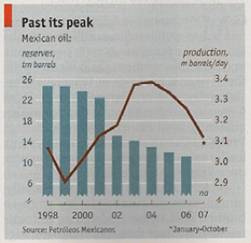 On the production front several major oil exporters have experienced problems the last few years. First, as evidenced by the chart of Mexican production at right (from the Economist) some exporting countries are having difficulty maintaining production in light of the advancing age and decline in some of their larger fields.
Mexico , the second largest exporter of crude oil to the U.S. , has seen production plummet from 3.4 million barrels a day three years ago to 3.1 million barrels a day – with the decline possibly accelerating over the next few years as production from the world-class Cantarell field declines.
The second major problem faced by major oil exporters is the fact that many are seeing dramatic increases in internal consumption – which limits any excess oil available for export. Many exporting countries subsidize the price of gasoline or diesel fuel for political reasons, which helps fuel increases in their domestic product demand.
 Meanwhile, back in the U.S. , we are seeing unusually low crude oil inventories if measured on a days of supply basis. U.S. stockpiles were at 293 million barrels late last month — down from 321 million barrels a year ago, according to the Energy Department. Some commentators have noted that on a days of supply basis we have not seen such low inventories in decades. The two year chart at right is courtesy of the Energy Information Administration (EIA).
Residential heating oil prices have risen to record levels – which has created financial issues for many residents in the Eastern U.S. who heat with oil. Several states have established emergency funds to assist the poor in purchasing heating oil.
 As an aside, surveys indicate the use of wood stoves has increased 25% in the last year in New Jersey as wood prices have remained relatively stable. Wood smoke pollutes at dozens of times the intensity of fuel oil or natural gas scientists say, with ash residue and wafted smoke particles affecting air quality and water supplies. None-the-less heating with wood is cost competitive with oil in some of these areas.
 U.S. gasoline and diesel fuel sells at prices 30-40% above year-ago levels. Even with the higher prices gasoline use was 0.3% above year ago levels according to the most recent EIA report.
A survey of stations by MasterCard put the increased year-over-year demand in late December at 1.2%. Diesel imports to China are hitting new records it was announced last month, and are expected to accelerate into the summer months, which will not help to moderate prices. Data indicates the higher U.S. prices do not seem to be impacting demand.
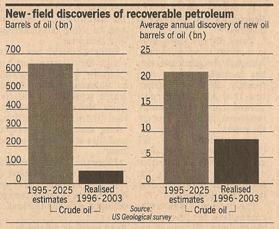 Another interesting article in the Financial Times last month discussed the long-term study of global crude oil supplies and resources prepared by the U.S. Geological Society in 2000.
The study was “the most thorough and methodologically modern assessment of world crude oil and natural gas resources ever attempted. This 5-year study was undertaken ‘to provide impartial, scientifically based, societally relevant petroleum resource information essential to the economic and strategic security of the United States .'"
The U.S.G.S. study concluded that between 1996 and 2025 roughly 21 billion barrels of oil would be found in new fields every year. Actual exploration results from 1996 to 2003 indicate only 9 billion barrels per year have been found – 60% less than forecast. (Chart at left courtesy of the Financial Times).
For such a detailed and essential strategic study we find the shortfall in exploration results to date absolutely stunning.
Last, the Edison Electric Institute power generation data indicates that weekly power generation levels in the U.S. have increased roughly 3.5% over year earlier levels. Demand for power, even in a slow growing developed economy like the U.S. , continues to expand. All of which bodes well for energy sector investors in 2008 and beyond.
By Joseph Dancy,
Adjunct Professor: Oil & Gas Law, SMU School of Law
Advisor, LSGI Market Letter
Email: jdancy@REMOVEsmu.edu
Copyright © 2007 Joseph Dancy - All Rights Reserved
Joseph R. Dancy, is manager of the LSGI Technology Venture Fund LP, a private mutual fund for SEC accredited investors formed to focus on the most inefficient part of the equity market. The goal of the LSGI Fund is to utilize applied financial theory to substantially outperform all the major market indexes over time.
He is a Trustee on the Michigan Tech Foundation, and is on the Finance Committee which oversees the management of that institutions endowment funds. He is also employed as an Adjunct Professor of Law by Southern Methodist University School of Law in Dallas, Texas, teaching Oil & Gas Law, Oil & Gas Environmental Law, and Environmental Law, and coaches ice hockey in the Junior Dallas Stars organization.
He has a B.S. in Metallurgical Engineering from Michigan Technological University, a MBA from the University of Michigan, and a J.D. from Oklahoma City University School of Law. Oklahoma City University named him and his wife as Distinguished Alumni.
Joseph Dancy Archive |
© 2005-2022 http://www.MarketOracle.co.uk - The Market Oracle is a FREE Daily Financial Markets Analysis & Forecasting online publication.