


Gold's Violent Downside Reversal
Commodities / Gold and Silver 2012 Mar 05, 2012 - 04:50 PM GMTBy: Clive_Maund

 Gold reversed violently to the downside last week, an event which has serious implications. It had been doing well up to that point and we did not see this reversal coming, so this is going to be "wise after the event" update - still it is considered to be better to be wise after the event than not wise at all, particularly if our interpretation of the meaning of this development proves to be correct.
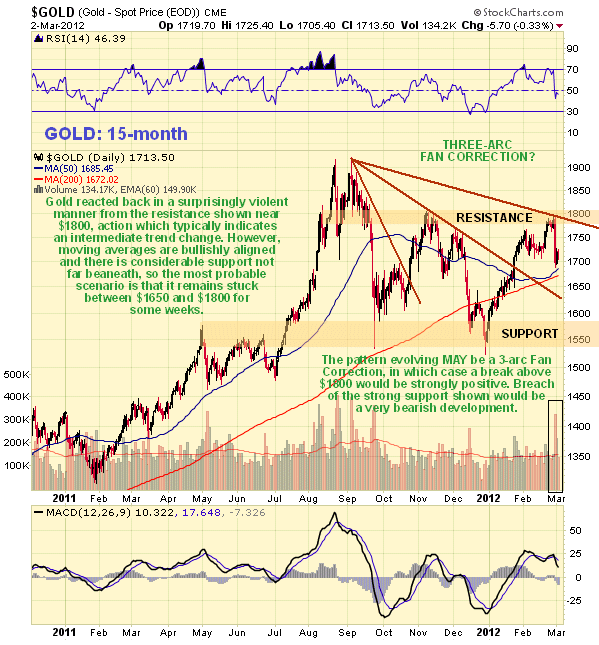
On its 15-month chart we can see that gold reversed after making a close approach to its highs of last November which formed beneath the resistance at the lower boundary of the top area of last August - September. Unable to break above these highs, it caved in last week. The magnitude of the drop on Wednesday and the high volume that accompanied it are a sign of an important reversal, so we can expect to see gold heading lower in coming days and weeks. While it is true that moving averages are in favorable alignment, this is unlikely to help much, and gold will not be "out of the woods" until it can break above the strong resistance towards and at $1800. The strong support shown on the chart at about $1550 must hold - if it fails gold will enter a bearmarket. At present gold can be considered to be rangebound.
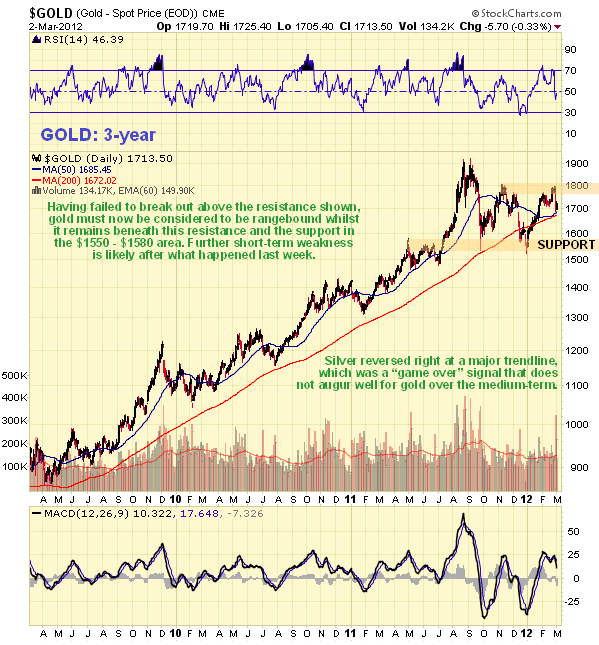
On the 3-year chart we can see the recent rangebound action of gold in the context of the long, steady uptrend that preceded it. Despite the positive alignment of its moving averages, action last week suggests that it is likely to head lower towards the key support over the short to medium-term, especially given that silver has just reversed after arriving at a major trendline. A clear break above $1800 will turn the picture much more positive.
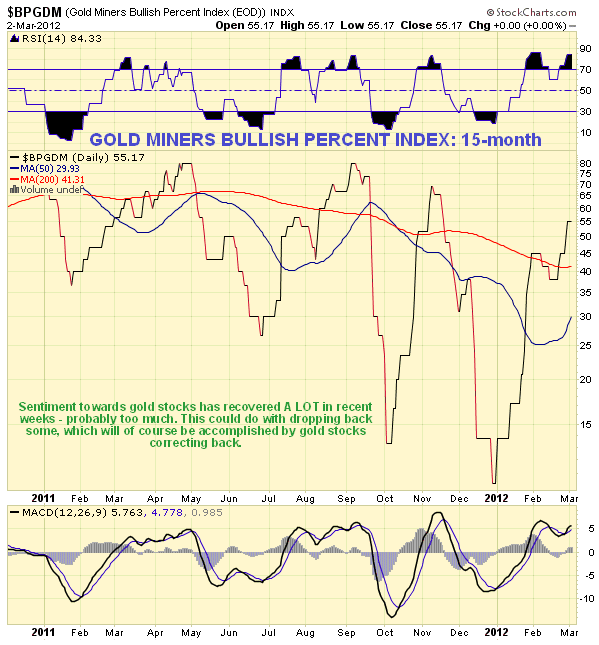
The latest chart for the Gold Miners Bullish Percent Index shows that investors are now a lot more bullish towards gold stocks than they were at the turn of the year, making a reaction here more likely.
By Clive Maund
CliveMaund.com
For billing & subscription questions: subscriptions@clivemaund.com
© 2012 Clive Maund - The above represents the opinion and analysis of Mr. Maund, based on data available to him, at the time of writing. Mr. Maunds opinions are his own, and are not a recommendation or an offer to buy or sell securities. No responsibility can be accepted for losses that may result as a consequence of trading on the basis of this analysis.
Mr. Maund is an independent analyst who receives no compensation of any kind from any groups, individuals or corporations mentioned in his reports. As trading and investing in any financial markets may involve serious risk of loss, Mr. Maund recommends that you consult with a qualified investment advisor, one licensed by appropriate regulatory agencies in your legal jurisdiction and do your own due diligence and research when making any kind of a transaction with financial ramifications.
Clive Maund Archive |
© 2005-2022 http://www.MarketOracle.co.uk - The Market Oracle is a FREE Daily Financial Markets Analysis & Forecasting online publication.