


Broad Market Recap for Currencies, Metals and Stocks
Stock-Markets / Financial Markets 2012 Mar 04, 2012 - 11:43 AM GMTBy: Chad_Bennis

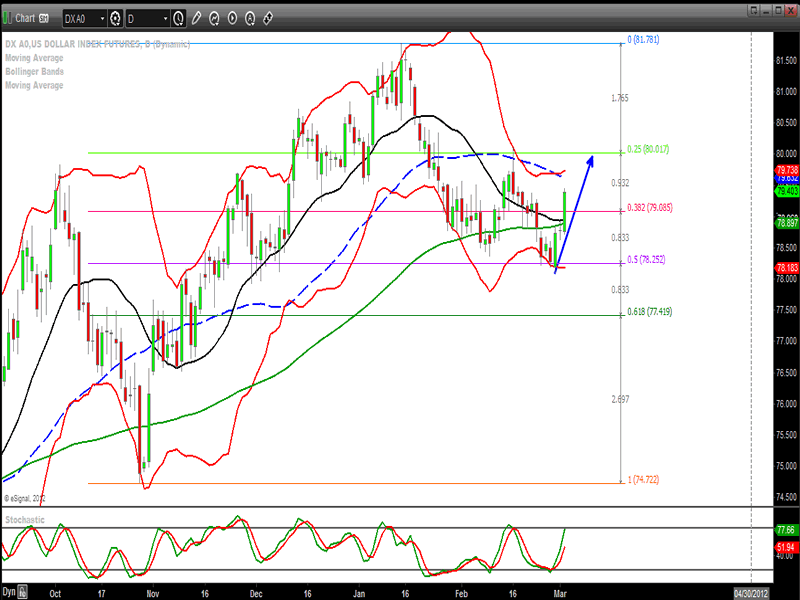
 The US dollar index staged a bullish engulfing candle last week putting in a bounce off the 50% retracement level and then pushed upwards in chart action staging an advance that pushed gold and silver lower.
Here is the daily US dollar chart.
The 4 hour chart shows the downtrend line being slightly pierced with overhead resistance at the 79.50 support/resistance level and the 25% retracement level at 80.05.
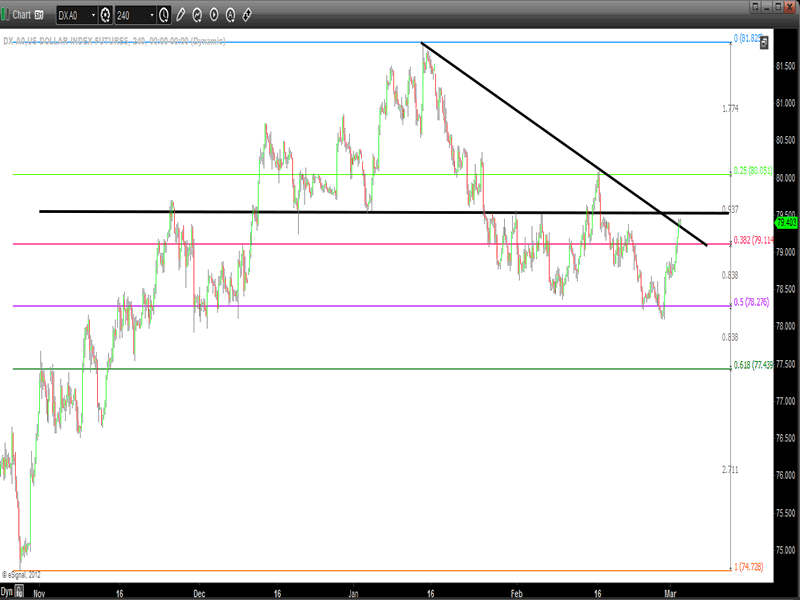
The US dollar will need to push through those levels significantly to change the overall trend of the dollar to an upwards bias. If not, then the dollar may enter some range trading while the markets establish a base at the current levels awaiting the dollar’s decision of which way it moves as we head into the second quarter of this year.
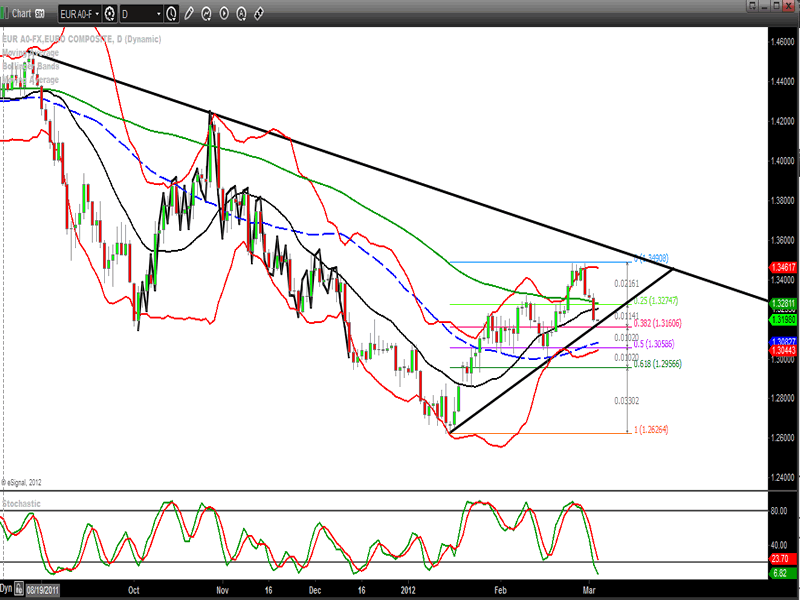
The euro corrected this week which added strength to the dollar’s surge. The euro’s correction took the price down to the 38.2% retracement and the still intact uptrend line. The currency now needs to hold this line and bounce higher to remain in its current uptrend. If it fails then there is support at the 1.3050 level which coincides with the 50% retracement level, the 45 dma and the lower bollinger band. These technical levels should provide strong support if the euro is to build a base awaiting the next trend.
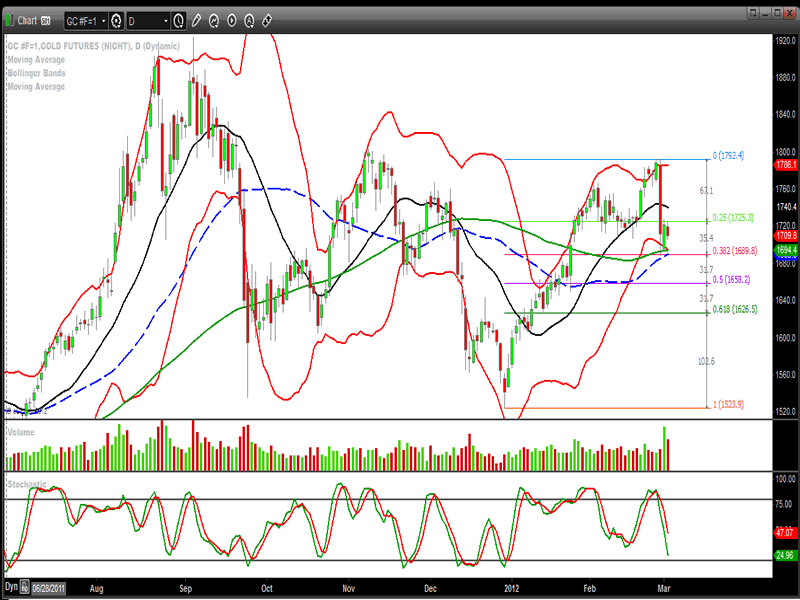
Gold was hit hard this week as Bernanke spoke. This quick downdraft pushed prices down to the 38.2% retracement level in short order with the 45 dma, 100 dma and lower bollinger band waiting to catch the decline. The next day showed a spike in volume as shorts more than likely covered their trade. The trend clock direction has now turned bearish with the 18 dma pointing lower. Gold needs to rebuild its chart before any assumptions can be made about future price movements. Although, one shouldn’t be surprised if this week’s low is taken out for one more good shake out. This market is currently influenced by the US dollar’s gyrations. Paying close attention to the dollar will provide clue’s in gold’s future movements.
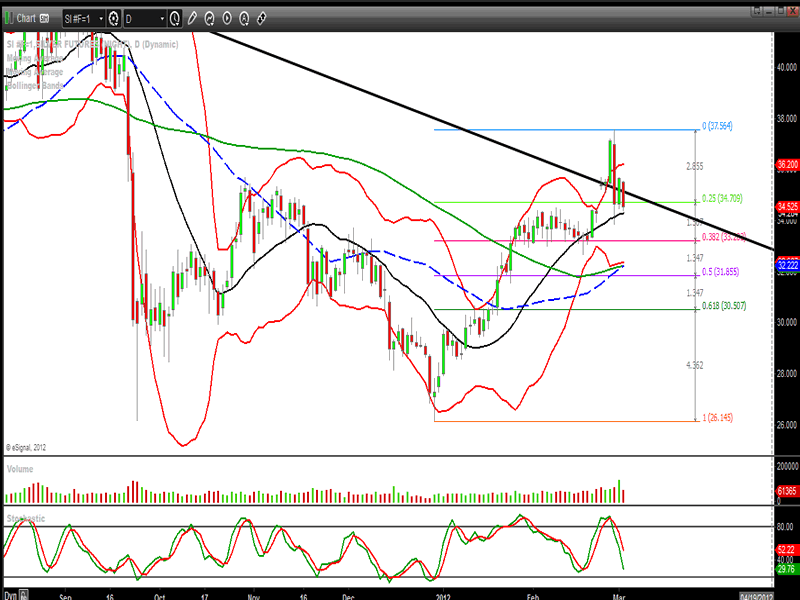
Silver briefly pierced its downtrend line before prices were squashed back below it on silver’s first attempt to break free of its range from last May’s highs. Currently the silver price remains in a bullish mode with prices above the 18 dma with trend clock directions still pointing higher in a bullish posture. Overhead resistance is at $34.70 and $36.20. Downside support sits at the 38.2% level of $33.20 with strong support at the 50% retracement, 45 dma, 100 dma and lower bollinger band levels of $31.85.
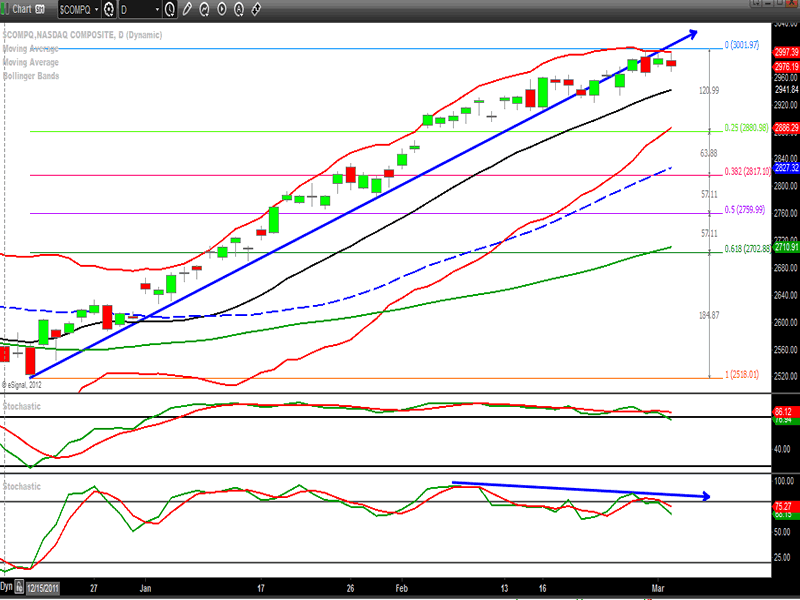
The Nasdaq composite index has broken its powerful uptrend line that began on December 19, 2011. The overhead round number of 3,000 has kept the index contained for the last 4 trading sessions. The upper stochastic (14,3,5) has lost its bullish embedded stochastic which can force prices to seek the the 18 dma, but if it embeds again on Monday then higher prices may be in store. The lower stochastic (5,3,3) shows a negative bearish divergence with prices making higher highs while the indicator made a lower high. This divergence can point at weakness in the prevailing uptrend which could forecast a correction in this months long uptrend in price action. Initial downside support is at the 18 dma at 2941 with 2880 below. Trend clock direction and formation remain very bullish at this time.
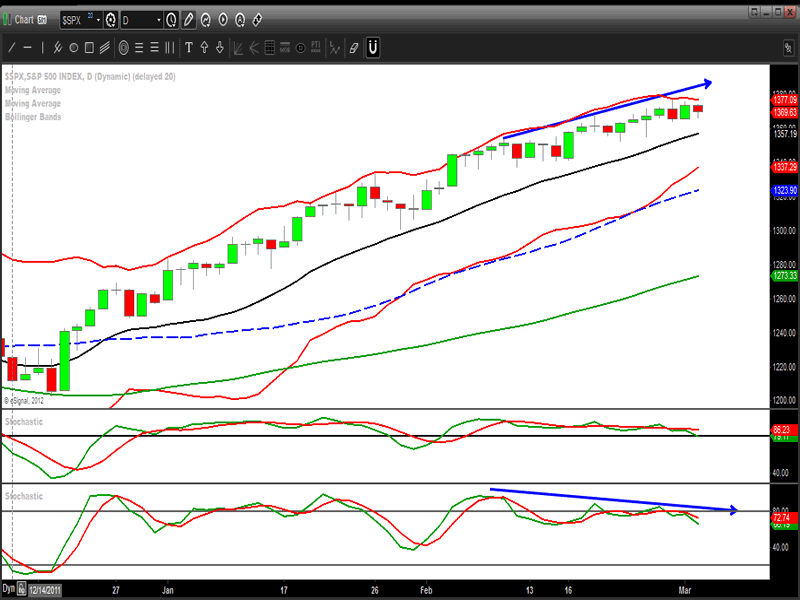
The S&P shows the same characteristics as the nasdaq chart above.
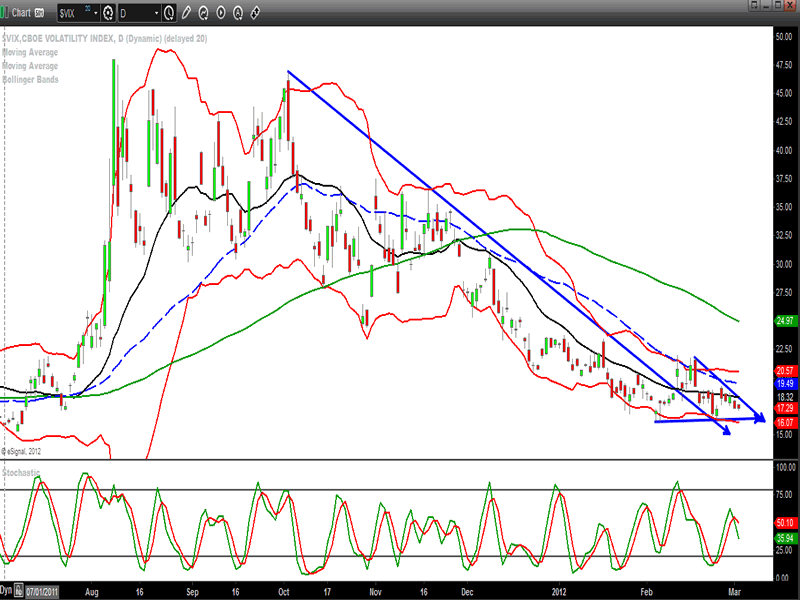
The VIX indicator has broken its long standing downtrend line to the upside over the past couple of weeks. There is now a pennant formation in action on the chart. It could also be viewed as a bull flag. What the chart needs to see is a break above the current downtrend line. If this occurs it may lead to higher price action in the coming trading sessions coupled with a correction in the equity markets.
Dr. Chad Bennis
-an independent thinker and trader
www.wheatcorncattlepigs.wordpress.com
Dr.ChadBennis@gmail.com
© 2012 Copyright Dr. Chad Bennis - All Rights Reserved
Disclaimer: The above is a matter of opinion provided for general information purposes only and is not intended as investment advice. Information and analysis above are derived from sources and utilising methods believed to be reliable, but we cannot accept responsibility for any losses you may incur as a result of this analysis. Individuals should consult with their personal financial advisors.
© 2005-2022 http://www.MarketOracle.co.uk - The Market Oracle is a FREE Daily Financial Markets Analysis & Forecasting online publication.