


Will the Gold and Silver Smackdown Deter Investors?
Commodities / Gold and Silver 2012 Mar 03, 2012 - 06:13 AM GMTBy: Eric_McWhinnie

Leap Day was very unkind to precious metals. The extra trading day in February delivered gold and silver their biggest one-day loss this year. Gold for April delivery fell $100 before closing down $77.10 and settling at $1,720 per ounce. Meanwhile, silver for March delivery plummeted $2.56 to close at $34.58 per ounce. Although this type of price action may seem troubling for newcomers, it is becoming routine for seasoned precious metal investors.
The sharp pullback in gold and silver started slightly before Ben Bernanke delivered the Federal Reserve’s semiannual Monetary Policy Report to Congress, and intensified as Bernanke did not offer any new stimulus measures. He even said the inflation outlook remained “subdued.” Much of the decline in precious metals were placed on the mouth of the Fed Chairman, but if this was the case, other investments would have sold-off as well. Instead, the S&P 500, Dow Jones Industrial Average and NASDAQ barely budged. Other investments such as crude oil actually climbed higher.
The amount of volume during the sell-off in both gold and silver was simply staggering. In a matter of minutes, more than 150 million paper ounces of silver were sold into the market. This represents more silver than Mexico, the worlds largest silver producer, mines in an entire year, according to The Silver Institute. The rapid sell-off in silver was speculated to be caused by a large trader such as a bullion bank selling gold without any regard to price, in order to produce a panic in precious metals. In a note to clients, CIBC World Markets wrote, “Looks like a large seller of gold in the market. A 10,000 contract traded, down ticked the price by $40 per ounce. Roughly 200,000 contracts trade per day, but unusual to see such a large single trade, not likely due to contract expiry either. That transaction represents 1 million ounces of gold.”
Billionaire Hugo Salinas, founder of Mexico’s Elektra retail chain, voiced his reaction to the sharp pullback in a recent interview. He said, “I look at the graph of the gold price and when it collapses down $100 in about an hour, that is not natural market action. I think people are getting used to this. This is standard procedure and it doesn’t worry me at all.” According to volume in popular precious metal ETFs, it appears Salinas is not the only investor getting used to volatility. The day after the sharp pullback, the SPDR Gold Trust bounced back with 19.1 million shares of volume, compared to a three-month average of only 12.7 million shares. Meanwhile, the iShares Silver Trust experienced trading volume of almost 30 million shares, compared to a three-month average of 19.5 million shares. Furthermore, UBS recently noted that physical gold flows to India were about three times the average volume and the strongest since September. “A cheaper gold price on Thursday elicited a hard-to-miss response from physical players across various regions,” Edel Tully, an analyst at UBS, explained. Knowledgeable investors were waiting for any pullback and Leap Day provided them with a red tag sale.
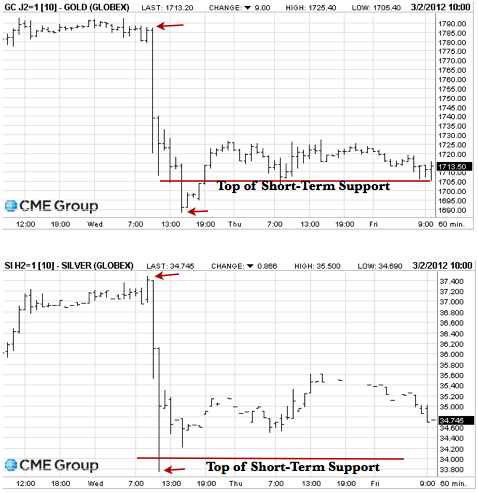
As the charts above show, on February 29, gold prices dropped from $1,790 to as low as $1,688 per ounce. Two days before the drop, we warned our premium newsletter subscribers that gold was nearing very challenging resistance at $1,800. However, subscribers were prepared to buy the dip as we explained support will be seen at $1,680-$1,705. This is exactly how the scenario is playing out as gold prices held our support range and currently trade around $1,710. The technical picture in silver is very similar. We predicted that silver could make a push to $37 very quickly this week, but resistance would be seen near $38. Silver topped out just above $37.40 and declined to our support range of $33-$34, providing another buying opportunity for investors looking to preserve their wealth in hard assets.
Although gold and silver receive more than their fair share of selling pressure, they continue to remain the best option to preserve wealth. Even with the recent decline, silver is still the best performing asset class year-to-date. Meanwhile, gold prices have posted annual gains for the past decade, as central banks around the world continue to print money in hopes of spurring a recovery. Bernanke did not announce any new quantitative easing measures this week, but history shows more money printing will come.
For more analysis on our support levels and ranges for gold and silver, consider a free 14-day trial to our acclaimed Gold & Silver Investment Newsletter.
By Eric_McWhinnie
Wall St. Cheat Sheet : Only days after the S&P 500 crashed to the depths of hell at 666, the Hoffman brothers launched Wall St. Cheat Sheet: one of the fastest growing financial media sites on the web. Like a samurai, our mission is to cut through the bull and bear shit with extraordinary insights, a fresh voice, and razor-sharp wit. We provide the highest quality education and information for active investors, financial professionals, and entrepreneurs.
© 2012 Copyright Eric McWhinnie - All Rights Reserved
Disclaimer: The above is a matter of opinion provided for general information purposes only and is not intended as investment advice. Information and analysis above are derived from sources and utilising methods believed to be reliable, but we cannot accept responsibility for any losses you may incur as a result of this analysis. Individuals should consult with their personal financial advisors
© 2005-2022 http://www.MarketOracle.co.uk - The Market Oracle is a FREE Daily Financial Markets Analysis & Forecasting online publication.