


Gold Fractal Projection of $3,500 into Mid 2012 Remains Intact!
Commodities / Gold and Silver 2012 Mar 01, 2012 - 10:53 AM GMTBy: GoldRunner

 As we have discussed in a previous article, our Fractal Model suggests the wave for Gold in US Dollars will sweep up into the $3500 to $3600 area into the mid-year time-frame. The leading edge of that time-frame begins in May and extends out for a few months. A potential for Gold to spike to a $3900 extended fib level exists. Like all parabolic moves in Gold, the late stages create the biggest price movements. Personally, I would be happy with a huge Gold run up to the $3200 level.
Our description of the Gold tsunami wave to come this year as a result of the huge wave of Dollar Inflation initiated by the $600 Billion US Dollars sent to Europe back in December of 2011 is beginning to be noticed by the markets. This is a very important “point of recognition.”
The fundamentals for this wave in gold are as follows:
- The massive world debt load demands that we either see a deflationary depression; or that we devalue the debt by devaluing the paper currencies. The politicians have chosen to dramatically devalue the paper currencies.
- The Federal Reserve is the only Central Bank with the right to print to infinity, thus, US Dollar printing will remain the leader going forward.
- Gold moves almost directly inverse to the value of the Dollar. Thus, the acceleration of Dollar Devaluation will drive the price of $Gold in its accelerating parabolic climb. (The USD Index has little to do with the “value of the Dollar” as we will soon show via “The Fractal Dollar” in a different writing.)
- This current leg of Dollar Printing via in the $600 Billion Dollars sent to the European Central Bank in a swap arrangement back in December of 2011 is just the start of this wave with Dollar printing demands to increase the debt ceiling, to cover losses by Fannie and Freddie, to continue to pay extended unemployment insurance benefits, and so on. Yet, the “lowly sum” of $600 Billion of Dollar Printing via QE drove Gold up to the $1920 level, and that much kicked off this round.
- Debt monetization via QE sends no new Dollars directly into the economy since the newly printed Dollars go directly from Uncle Sam’s hands to cover the item listed, above. Thus, these newly printed Dollars only “replace Dollars” that were never allotted for all of the above items and other responsibilities like the unfunded Social Security Funds and Federal Pensions. As such, the economy is not directly helped by the new Dollar printing. As the economy continues to deteriorate it demands an acceleration of new Dollars to be printed. It’s like a cat chasing its own tail.
- The US needs to devalue the US Dollar to the point that the debt is devalued to manageable level. The Dollar is devalued against “relatively constant valued Gold”; just like the late 70’s when Gold went parabolic. Unfortunately, the massive amount of Dollar printing this time around could not be done via the loan multiplier system where the new Dollars go directly into the economy. So Dollar creation via direct debt monetization, QE, had to be done after the loan multiplier system was “blown out” in 2007 and 2008.
- The talk about “manipulation of the Gold Market” was in reference to the government’s need to prevent Gold from going into “free-rise”, prematurely, before the cycle point the above would have been jeopardized. Now, we are past that point in the cycle, and the government “needs Gold to go parabolic” to devalue the huge debts. The government needs the huge Dollar Devaluation to happen fairly quickly to prevent the economy from completely tanking. This is a “fractal cycle” that periodically repeats through history creating the Gold parabola, and like all fractal cycles there is a “fractal time factor” in play. This cycle does not seek to destroy the US Dollar, but ultimately, to prevent its destruction- though the Dollar will have to be backed by something of value in the end.
- As the huge Devaluation of the Dollar starts its more aggressive moves, everything denominated in Dollars will be devalued along with it. The ONLY way one will be able to “view” the true extent of Dollar Devaluation will be via the chart of $Gold- the ratio chart of Gold to the US Dollar. Watch the chart of Gold drive to parabolic heights like the late 70’s while the “Dollar Index” trades sideways to down.
- As the chart of Gold blows dramatically higher, it is will represent what is going on in all parts of your life if your life is denominated in US Dollars. Your pension, your social security benefits, your cash in the bank - they will be losing value in a fairly direct relationship to how the US Dollar is being devalued against Gold. This is why Mr. Jim Sinclair says that “Gold is INSURANCE” during this time period. He is saying that Gold will rise inversely to the amount of Dollar Devaluation that is in progress.
- After this large run in Gold corrects, the fractal model suggests that Gold will make another run up into the $10,000 to $12,000 territory. We laid out those numbers as the ultimate targets for Gold back in 2007 and 2008 via the fractal work. Numbers for Gold higher than that would suggest the potential for “hyper-inflation.”
[In response to requests from our followers GoldrunnerFractalAnalysis.com is starting a free newsletter of sorts, called Goldrunner’s Fractal Corner where we will discuss current market and economic issues in a bit simpler way. You can request to receive this free newsletter by sending an e-mail to GOLDRUNNERBLOG44 @AOL.COM. Anyone interested in subscribing to our subscription service can subscribe here where we provide unique and proprietary fractal analyses and charting for gold, silver, the HUI and a number of individual precious metals stocks.]
THE CURRENT GOLD CHARTS
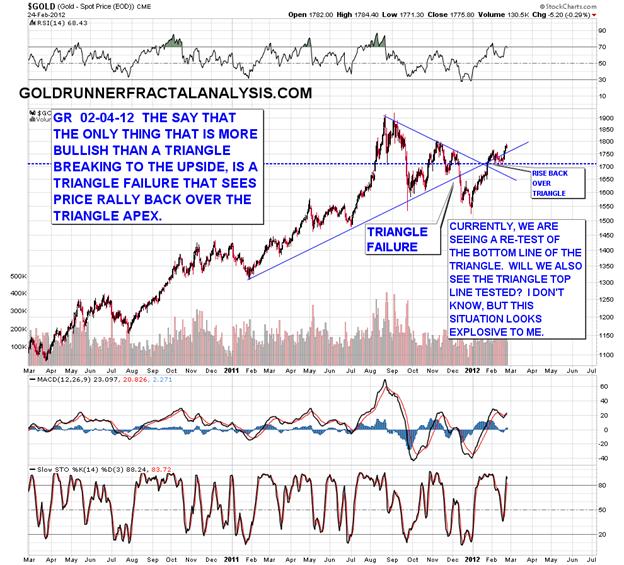
“They” say that the only thing more bullish than a triangle break-out is a triangle that breaks down, followed by price driving back above the triangle apex. That is precisely what Gold has done in the chart, below. This is exactly what needed to happen for our Gold Fractal Model to play out. We can see on this chart that Gold has already “broken out” over the main downtrend line in blue as it rose above the triangle apex to consolidate above a horizontal line through the apex. There is only minor horizontal resistance left above $1800 with all “angled resistance” in the rear view mirror for Gold.
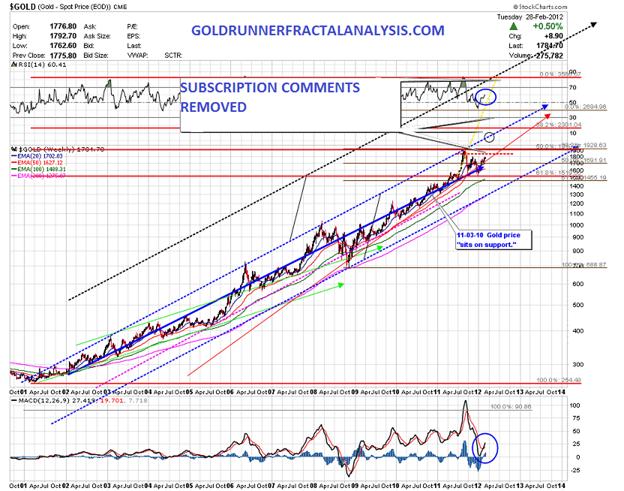
Per the next Gold chart, the “main” resistance areas left for Gold are horizontal resistance at the old top, then the top of the log channel that lies up around $2100. The Gold Fractal Model suggests that we will see Gold hit zones of angled resistance above that point before the real parabolic rise begins. A successful break through the channel top would send Gold flying, and the coming Dollar Inflation should provide the legs.
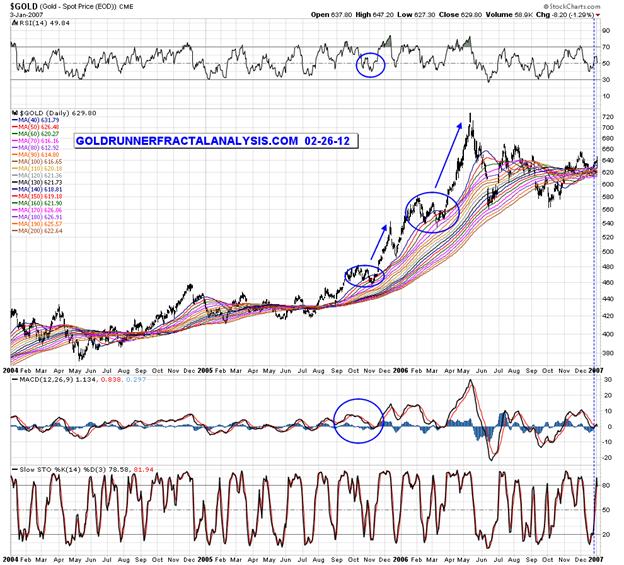
We recently showed subscribers an interesting chart formation in the 2005/ 2006 period that appears to be very similar to the Gold chart today. That 2005/ 2006 period is a unique secondary fractal period, but these similarities appear to fall under the title of “price pattern analysis.” We often see chartists pointing to price patterns as “fractal in nature”, but they tend to fall under the heading of “price pattern similarities.” The only other individual that I have seen do true fractal work with historical significant time and price relationships has been Mr. Armstrong with the fractal work he developed off of the DJIA. No doubt, price pattern analysis can be a very effective and powerful tool in the right hands.
The first chart, below, is the 2005/ 2006 Gold chart with two separate and similar price pattern corrections circled in blue. For the 2005 correction, I have circled the RSI and MACD indicators since they also look like practical twins to today. These formations show how Gold dipped back to the top of the moving average ribbon, then dropped a second time a bit deeper into that ribbon. After that, price exploded higher, much like we expect it to do in the coming period. The time relationships for these price patterns are different, but look at the similarities in the TA indicator formations to the following chart for the current time period. In my opinion, an explosion is coming!
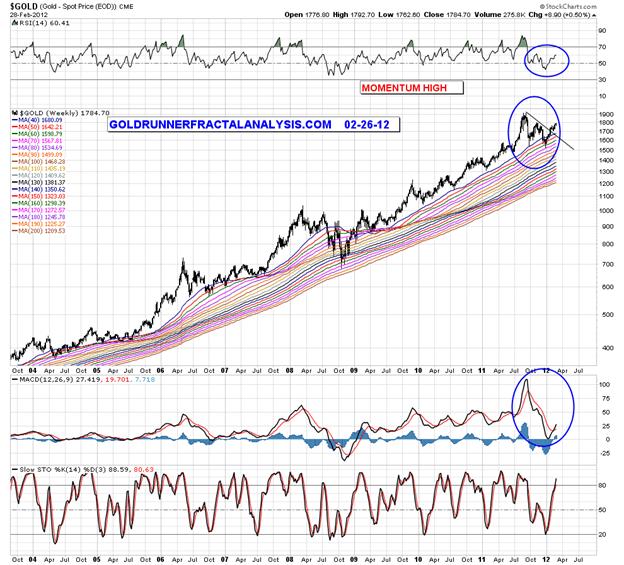
The next chart shows the current very similar price and TA patterns that closely match the 2005 Gold chart.
As a final note, this writing is going out after the sharp reaction in Gold and Silver, today, Wednesday. This reaction changes nothing important in terms of the underlying fundamentals at hand, nor the intermediate-term technical picture.
Again, if you’d like to be added to our mailing list to receive our new and Free newsletter, Goldrunner’s Fractal Corner, all you have to do is to send an e-mail to GOLDRUNNERBLOG44@AOL.COM. A link to our subscription service can be found here.
For the moment,
Goldrunner
Please understand that the above is just the opinion of a small fish in a large sea. None of the above is intended as investment advice, but merely an opinion of the potential of what might be. Simply put: The above is a matter of opinion and is not intended as investment advice. Information and analysis above are derived from sources and utilizing methods believed reliable, but we cannot accept responsibility for any trading losses you may incur as a result of this analysis. Comments within the text should not be construed as specific recommendations to buy or sell securities. Individuals should consult with their broker and personal financial advisors before engaging in any trading activities. Do your own due diligence regarding personal investment decisions. In the interest of full disclosure, GOLDRUNNER is personally invested in the Precious Metals sector including various Precious Metals and other individual stocks. GOLDRUNNER reserves the right to modify or eliminate any or all positions at any point in time.
© 2005-2022 http://www.MarketOracle.co.uk - The Market Oracle is a FREE Daily Financial Markets Analysis & Forecasting online publication.