Is the Corporate Earnings Recovery a Deception?
Companies / Corporate Earnings Feb 28, 2012 - 03:29 AM GMTBy: Clif_Droke
 The market has come a long way since October when the price low was established in the major stock averages. It has come even further when compared to its March 2009 bear market low. To put the market recovery into perspective, for the three years since the recovery began in '09 until now, the S&P 500 (SPX) has gained over 100%. For the nearly two years since the July 2010 low, the SPX has gained 85%. For the six month's since last October's low, the SPX has gained 9%.
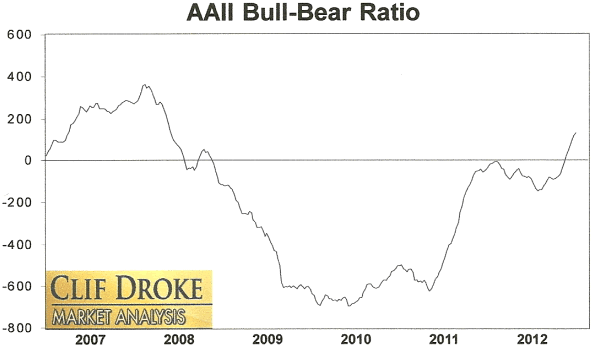
But stocks prices aren't the only things to have changed in the last three years. Investor sentiment has made a major U-turn in just the past few months as can be seen in the AAII investor sentiment survey chart below. It can also be seen by comparing some financial news headlines from then and now. To take just one sampling, as recently as August 2011, a bevy of news articles appeared in several business publications which highlighted the poor outlook for many business. In the August 14 issue of Businessweek magazine at least two articles underscored the poor condition of the housing market and how this was hurting small business.

In September, Businessweek ran an article with the bold headline, "ARMAGEDDON" in describing a culture of fear among small investors who worry about equity market gyrations. The article reported the results of a study among General Y'ers which found that 40 percent of them agreed they'd "never feel comfortable investing in the market." The article also emphasized the underperformance of money managers in 2011 and concluded, "Global economic concerns are overwhelming market fundamentals, thwarting the strategies of fund managers who pick stocks."
One money manager in particular, James Paulsen, the chief investment strategist at Wells Capital Management, summed up nicely last year's investor nervousness when he said (in September), "The mindset is so skittish that even evidence of an economic soft patch is immediately extrapolated to recession or depression."
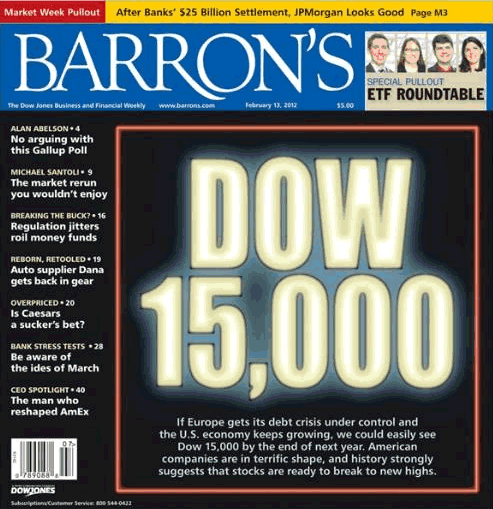
But oh, how things have changed since September! Investors and the media alike have gone from one extreme to another: from extrapolating bad news into something worse to extrapolating good news into something better. A case in point is today's glowing headlines which have emphasized the nascent recovery in certain segments of the real estate market as well as the employment outlook. Investor sentiment has also gotten a boost in recent months with the venerable Barron's putting a "Dow 15,000" headline on its front cover last week.

The above example could easily fall under the category of the venerable "magazine cover indicator" if this were an even bigger mainstream publication than Barron's. Nevertheless, the Barron's cover does suggest to us that investor sentiment has temporarily come too far, too fast, and therefore a mild market correction (or else a "pause that refreshes") would be in order.
A couple of indicators worth keeping an eye on in the coming days should prove to be instructive. One such indicator is the stock chart for FedEx Corp. (FDX), a major barometer for business as well as a leading/confirming indicator for the broad market. FDX has been under pressure lately. The stock has recently broken its short-term uptrend in response to rising fuel costs. While it's true that rising oil prices can be somewhat beneficial to the earnings of many S&P companies, there comes a tipping point (as in mid-2008) when continued rising oil prices hurt corporate earnings and are hence reflected in stock prices. A continued run-up in the crude oil price from here could spook investors in the immediate term and lead to some temporary selling pressure.
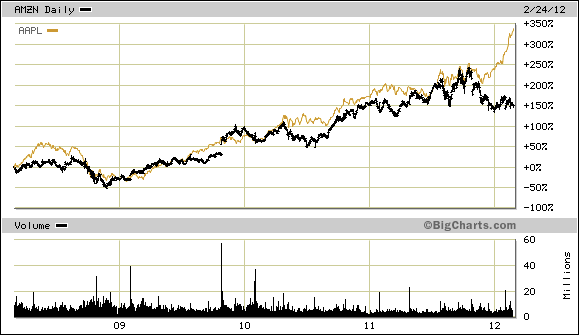
Another indicator to keep an eye on in the next few days is the Amazon/Apple ratio. The following graph is a simple comparison of the stock prices for tech leader Apple Inc. (AAPL) and online retailer Amazon.com (AMZN). There is typically a sympathetic price performance between both stocks. But when one of these stocks gets out of line with the other one, a correction typically follows in which the stock that has overshot on the upside (in this case AAPL) comes back closer into line with the laggard.

The recent disparity between the price performance of AAPL and AMZN has been the biggest such divergence in several years. It suggests that AAPL should soon pull back at least somewhat and cool off its recent overheated technical condition. Assuming this happens, it would have a spillover effect in the broad market since AAPL is one of the larger components of the S&P 500 index by weighting.
Speaking of Apple, there was an interesting feature in a recent issue of Businessweek with Tom Keene interviewing Jonathan Golub, chief U.S. equity strategist for UBS. Mr. Golub was asked about Apple's earnings outlook.
In a recent essay, Golub stated that without Apple's earnings, total U.S. corporate earnings growth goes from being in the mid-teens to only 2 percent. He told Keene that Apple's earnings "obfuscate" the underlying trend in corporate earnings, which he says is "really weak." He also pointed to stronger growth in foreign markets and high oil prices, both of which are good for S&P profits, along with a weaker dollar, as contributors to the profit trend.
Mr. Golub questions how the U.S. could have 2 percent economic growth in the face of 16-17 percent earnings growth. He reasons that cost-cutting and other corporate measures cannot explain the stellar earnings trend of the past couple of years. "If you take away that one name [Apple]," he says, "you get greater clarity on the fact that earnings are moving much closer with the direction of the economy."
While I think it's too early to start putting on the bear suits, the point that Mr. Golub makes is worth remembering, especially after the 4-year cycle peak and presidential election later this year.
Stocks vs. Gold
Will 2012 be the year where stocks trump all other asset categories? Warren Buffett seems to think so. He told Fortune magazine that stocks will be "the runaway winner" over bonds and gold this year and "will be by far the safest" investment in the long run.
Buffett believes that bonds tied to currencies are dangerous assets that "should come with a warning label" and are tied to interest rates that are so low they can't cover losses from inflation and taxation. Surprisingly, he also said investors should avoid gold, which he says will "never produce anything." Instead, he advises investments in farmland or corporate shares.
Concerning the yellow metal, Buffett rehearsed the bromide that the world's known supply of gold, if melted down, would form a 68-square-foot cube worth just under $10 trillion. Better to own, says Buffett, the combined cropland in the U.S. along with the leading oil companies than the precious metal.
Buffett's proposition is debatable and only time will tell if the Sage of Omaha will be proven correct. As for gold's prospects in 2012, even if Buffett is right that stocks outperform gold for the year, the yellow metal has a built in insurance policy courtesy of the ongoing European debt saga. While Europe may have bought itself a temporary reprieve courtesy of the ECB's loose money policy, those chickens will once again come home to roost - most likely before the year is out.
The underlying bias created by the rising 4-year cycle will only last until around the elections this fall. Experience teaches that when a longer-term year cycle peaks and is no longer providing support, monetary policy tends to lose its force and the underlying fundamental factors behind an economic crisis come to the forefront. Gold stands to gain from a return of investor fear, which will manifest once it is shown that Europe's debt woes are far from being cured.
While we're on the subject of the stock market's strong performance this year, it's interesting that many traders and analysts have used the term "steroid-fueled" to describe the rally that began last fall and has persisted until now. Stocks apparently aren't the only things on steroids; Wall Street traders are on the juice as well. According to Charles Wallace in the Financial Times, many Wall Street bankers and traders are taking male-hormone supplements in hopes it will "sharpen their faculties and make them more competitive."
Dr. Lionel Bissoon, a New York specialist in testosterone therapy, says that 90 percent of his clients are involved in the financial industry. Elevated testosterone levels - and the aggressive risk-taking that resulted from it - have been blamed on bring on the credit crisis. It's somewhat ironic that Wall Street types are now paying for an extra dose of chemically induced aggression.
As a famous comedian used to say, "This will not end well."
Gold & Gold Stock Trading Simplified
With the long-term bull market in gold and mining stocks in full swing, there exist several fantastic opportunities for capturing profits and maximizing gains in the precious metals arena. Yet a common complaint is that small-to-medium sized traders have a hard time knowing when to buy and when to take profits. It doesn't matter when so many pundits dispense conflicting advice in the financial media. This amounts to "analysis into paralysis" and results in the typical investor being unable to "pull the trigger" on a trade when the right time comes to buy.
Not surprisingly, many traders and investors are looking for a reliable and easy-to-follow system for participating in the precious metals bull market. They want a system that allows them to enter without guesswork and one that gets them out at the appropriate time and without any undue risks. They also want a system that automatically takes profits at precise points along the way while adjusting the stop loss continuously so as to lock in gains and minimize potential losses from whipsaws.
In my latest book, "Gold & Gold Stock Trading Simplified," I remove the mystique behind gold and gold stock trading and reveal a completely simple and reliable system that allows the small-to-mid-size trader to profit from both up and down moves in the mining stock market. It's the same system that I use each day in the Gold & Silver Stock Report - the same system which has consistently generated profits for my subscribers and has kept them on the correct side of the gold and mining stock market for years. You won't find a more straight forward and easy-to-follow system that actually works than the one explained in "Gold & Gold Stock Trading Simplified."
The technical trading system revealed in "Gold & Gold Stock Trading Simplified" by itself is worth its weight in gold. Additionally, the book reveals several useful indicators that will increase your chances of scoring big profits in the mining stock sector. You'll learn when to use reliable leading indicators for predicting when the mining stocks are about o break out. After all, nothing beats being on the right side of a market move before the move gets underway.
The methods revealed in "Gold & Gold Stock Trading Simplified" are the product of several year's worth of writing, research and real time market trading/testing. It also contains the benefit of my 14 years worth of experience as a professional in the precious metals and PM mining share sector. The trading techniques discussed in the book have been carefully calibrated to match today's fast moving and volatile market environment. You won't find a more timely and useful book than this for capturing profits in today's gold and gold stock market.
The book is now available for sale at: http://www.clifdroke.com/books/trading_simplified.html
Order today to receive your autographed copy and a FREE 1-month trial subscription to the Gold & Silver Stock Report newsletter. Published twice each week, the newsletter uses the method described in this book for making profitable trades among the actively traded gold mining shares.
By Clif Droke
www.clifdroke.com
Clif Droke is the editor of the daily Gold & Silver Stock Report. Published daily since 2002, the report provides forecasts and analysis of the leading gold, silver, uranium and energy stocks from a short-term technical standpoint. He is also the author of numerous books, including 'How to Read Chart Patterns for Greater Profits.' For more information visit www.clifdroke.com
© 2005-2022 http://www.MarketOracle.co.uk - The Market Oracle is a FREE Daily Financial Markets Analysis & Forecasting online publication.


