


Short Term Interest Rates and Their Implications, Under the Radar
Interest-Rates / US Interest Rates Feb 27, 2012 - 05:47 AM GMTBy: Tony_Caldaro

 When a potental economic downturn is first sensed investors gradually start to shift into what is perceived as safe assets, namely Treasury bills, notes and bonds. As more and more investors pick up on this scenario a trend begins to appear. When economic data starts to confirm the downturn, the shift to safety turns into a long term trend and rates drop substantially. The opposite, of course, occurs during an economic upturn. When this occurs investors gradually shift out of the Treasury safe haven, and rates begin to rise. The initial shift, in both situations, is quite subtle, but measurable. We track these events using the 1 year T-bill.
Historically, the 1 year T-bill is the market bellwether for short term rates. During economic downturns it leads the FED’s fed funds rates on the way down. And, during upturns it leads the FED’s fed fund rates on the way up. Essentially, the investor mass collective is always one or two steps ahead of the FED. We published an analysis of this phenomenon about a year ago: http://caldaro.wordpress.com/2011/01/18/interest-rates-the-economy-and-the-1yr-t-bill/.
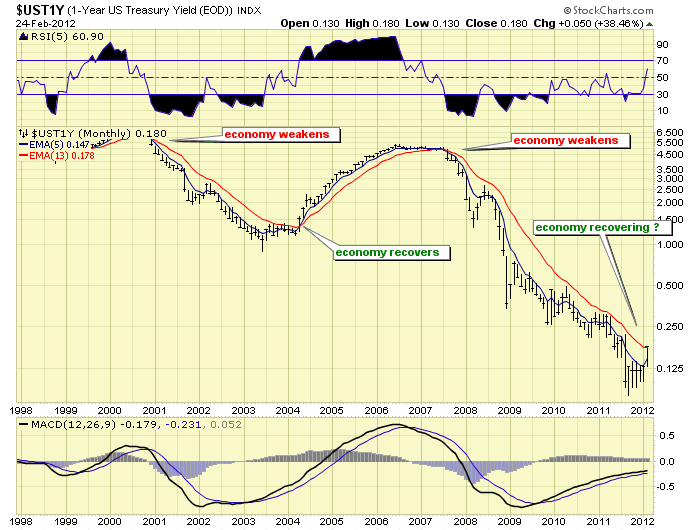
The monthly chart of 1 year rates displays the last three cycles. The 2000 peak in rates, and late 2000 economic downturn. The 2003 low in rates, and early 2004 economic upturn. Then the 2006 peak in rates, and the late 2007 economic downturn. Keep in mind, the stock market usually peaks and bottoms much earlier than confirmed shifts in flights to and from safety. This analysis is about an economic event, not a stock market event.
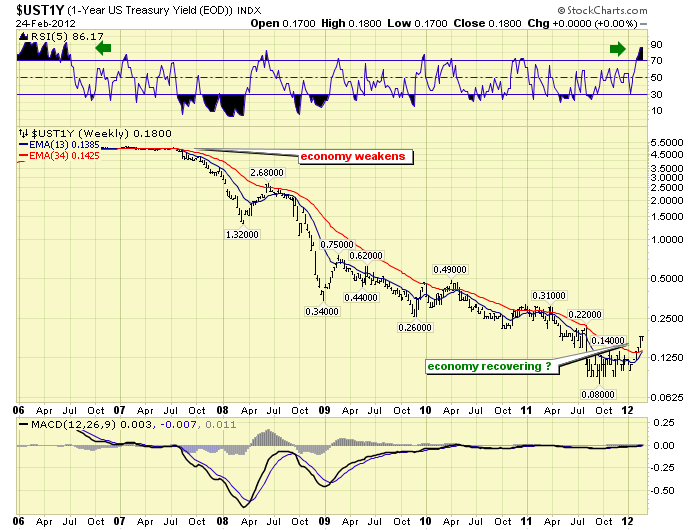
The weekly chart of 1 year rates displays a close up view of the 2007 downturn right into the historic mid-2011 low at 0.08%. Notice how each rally in rates went unconfirmed as a potential long term shift in investor sentiment. That shift may be underway now. The reason for this report. Observe how rates have recently more than doubled, generating the most overbought RSI reading since the 2007 downturn began.
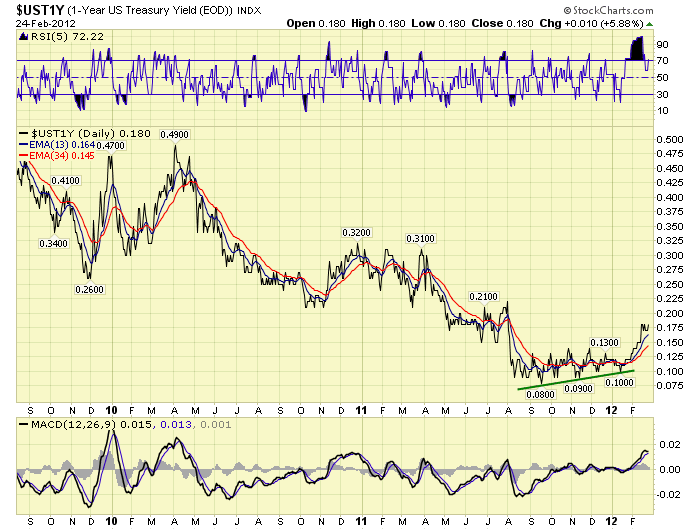
Now observe the daily chart recently hit an extremely overbought RSI condition, after a gradually rising bottoming process: 0.08%, 0.09% and 0.10%. This, again, may be the early signs of an actual shift in the investor mass collective from perceived safety to risk. Should this event occur it would create a major shift in not only investor psychology, but also FED monetary policy. The multi-year, (since late 2008), FED policy of using quantitative easing to fight deflationary pressures, may, unless properly managed, end up fueling an inflationary economic downturn in the near future. Keep in mind, FED policy often lags not only the markets, but also the economy. The investor mass collective is always one or two steps ahead of the FED.
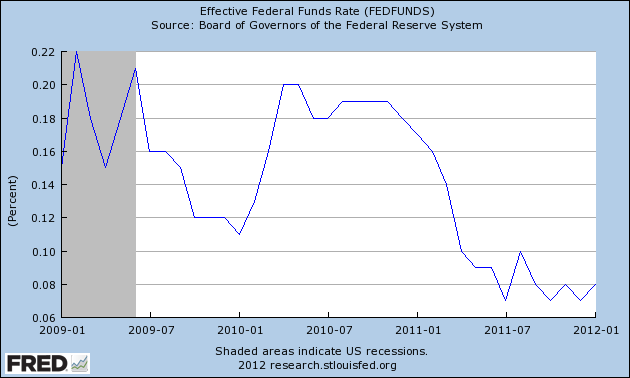
Since FED policy has been to maintain the FED funds rate between 0.00% and 0.25% we post a chart of the effective FED funds rates. Notice how it has been in a range between 0.07% and 0.10% for most of 2011. With 1 year rates currently at 0.18% the FED is perfectly aligned with what is required in this economy. Even if 1 year rates rise to 0.35% the FED would have no reason to change current policy. However, if 1 year rates start to rise beyond that level, the FED should begin to consider a tighter monetary stance. If they maintain the current policy while the 1 year rises beyond 0.50% an inflationary economic event will likely follow. We suggest investors keep an eye on 1 year rates and the FED’s reaction to those rates going forward. You can find our charts of 1 year rates, and others, on page 14 using the link below. Interesting times!
CHARTS: http://stockcharts.com/...
http://caldaroew.spaces.live.com
After about 40 years of investing in the markets one learns that the markets are constantly changing, not only in price, but in what drives the markets. In the 1960s, the Nifty Fifty were the leaders of the stock market. In the 1970s, stock selection using Technical Analysis was important, as the market stayed with a trading range for the entire decade. In the 1980s, the market finally broke out of it doldrums, as the DOW broke through 1100 in 1982, and launched the greatest bull market on record.
Sharing is an important aspect of a life. Over 100 people have joined our group, from all walks of life, covering twenty three countries across the globe. It's been the most fun I have ever had in the market. Sharing uncommon knowledge, with investors. In hope of aiding them in finding their financial independence.
Copyright © 2012 Tony Caldaro - All Rights Reserved Disclaimer: The above is a matter of opinion provided for general information purposes only and is not intended as investment advice. Information and analysis above are derived from sources and utilising methods believed to be reliable, but we cannot accept responsibility for any losses you may incur as a result of this analysis. Individuals should consult with their personal financial advisors.
© 2005-2022 http://www.MarketOracle.co.uk - The Market Oracle is a FREE Daily Financial Markets Analysis & Forecasting online publication.