US Trade Deficit Trouble On The Horizon
Economics / US Economy Feb 12, 2012 - 05:56 AM GMTBy: Tony_Pallotta
 I'm intrigued how studying one economic data point can give you valuable insight into others. One such example is that of the recent US trade deficit. The December trade deficit increased to $48.8 billion from $47 billion in November. Although this report will have a slight negative impact on Q4 GDP there is something possibly more telling about the trajectory of the US economy.
At 70% of GDP the consumer is the most important "leading indicator" of economic expansion and or contraction. For example if the consumer is increasing spending retailers are expanding inventory. If retailers are expanding inventory then imports to the US are increasing.
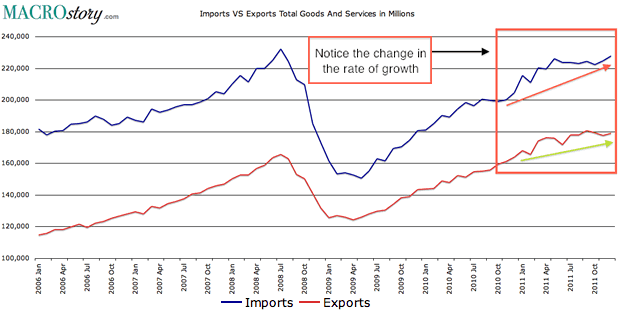
In studying December trade data we see a healthy improvement in imported goods (not including services) of 1.4% in December up from 1.3% growth in November and the (1.2%) contraction in October. But taking a step back and contrasting this improvement with the change in exports we see a widening trade deficit.
Although negative for the trade component of GDP this could be interpreted as positive for the consumer component. Notice the difference in growth rates between exports and imports. Imports are expanding at a faster pace which means the trade deficit should continue to expand.

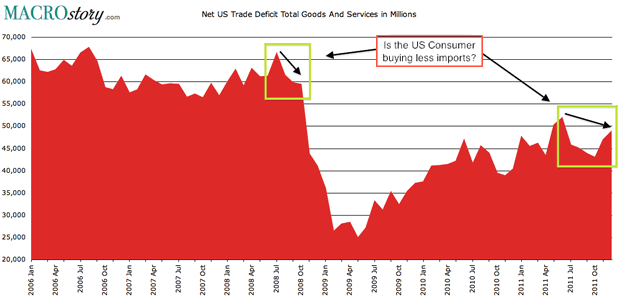
Now look at the net trade deficit on the chart below. After improving drastically during the 2008 recession as consumers stopped buying low priced imported goods it began to deteriorate again. As the economy expanded so did the consumer's ability to buy more imports.
Recently though it appears this trend is changing. Notice the decline in trend over the past few months with the exception of the November-December period. Which begs the question is November and December an anomaly or a change in trend.

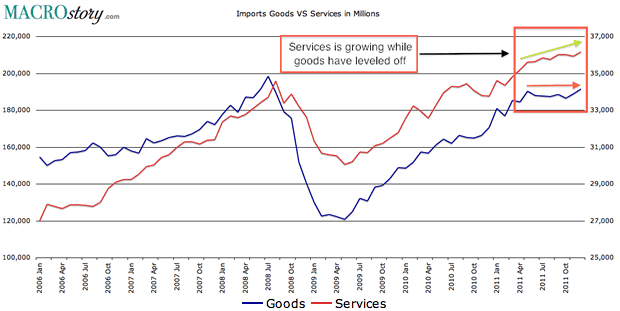
Digging deeper into the data and breaking down imports by "goods" and "services" shows that much of the recent growth in imports is attributed to services and not goods. In fact imported goods have been flat over the past few quarters while services have risen. It was only in November and December where we see an up tick.

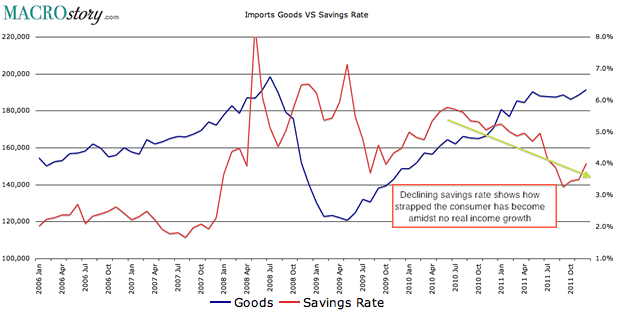
This brings me to the final chart which shows the change in imported goods versus the consumer savings rate. Although not a one for one correlation the trends do follow each other. What is interesting to note is the declining trend in consumer savings rate to multi-year low levels. In other words in the absence of real (inflation adjusted) wage growth the consumer is running out of much more buying capacity. Which supports the speculation that the increase November and December imported goods is not sustainable and more of an anomaly.
If in fact true as this chart shows a drop in consumer spending will lead to a drop in imports and thus an improved trade deficit. Sounds good but the last time the trade deficit improved dramatically was when the US economy had entered recession. As they say be careful what you wish for.

By Tony Pallotta
Bio: A Boston native, I now live in Denver, Colorado with my wife and two little girls. I trade for a living and primarily focus on options. I love selling theta and vega and taking the other side of a trade. I have a solid technical analysis background but much prefer the macro trade. Being able to combine both skills and an understanding of my "emotional capital" has helped me in my career.
© 2012 Copyright Tony Pallotta - Disclaimer: The above is a matter of opinion provided for general information purposes only and is not intended as investment advice. Information and analysis above are derived from sources and utilising methods believed to be reliable, but we cannot accept responsibility for any losses you may incur as a result of this analysis. Individuals should consult with their personal financial advisors.
© 2005-2022 http://www.MarketOracle.co.uk - The Market Oracle is a FREE Daily Financial Markets Analysis & Forecasting online publication.


