


Applying Fibonacci to Stock Market Patterns
InvestorEducation / Learn to Trade Feb 01, 2012 - 01:29 PM GMTBy: EWI

 Patterns are everywhere. We see them in the ebb and flow of the tide, the petals of a flower, or the shape of a seashell. If we look closely, we can see patterns in almost everything around us. The price movements of financial markets are also patterned, and Elliott wave analysis gives you the tools to interpret those patterns.
The Fibonacci sequence is vital to Elliott wave analysis -- as a matter of fact, R.N. Elliott wrote that the Fibonacci sequence provides the mathematical basis of the Wave Principle. Once you understand the Fibonacci sequence, it's easy to apply it to the markets you trade.
The following excerpt is from a new eBook from Elliott Wave International Senior Tutorial Instructor Wayne Gorman: How You Can Use Fibonacci to Improve Your Trading. Wayne explains how the Fibonacci sequence is derived and how it can be used to understand market behavior.
Learn how you can download the entire 14-page eBook below.
The Golden Ratio and the Golden Spiral
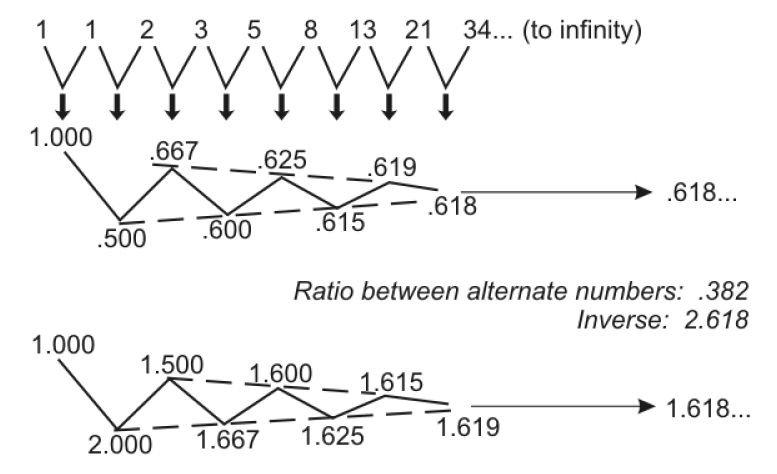
Let's start with a refresher on Fibonacci numbers. If we start at 0 and then go to the next whole integer number, which is 1, and add 0 to 1, that gives us the second 1. If we then take that number 1 and add it again to the previous number, which is of course 1, we have 1 plus 1 equals 2. If we add 2 to its previous number of 1, then 1 plus 2 gives us 3, and so on. 2 plus 3 gives us 5, and we can do this all the way to infinity. This series of numbers, and the way we arrive at these numbers, is called the Fibonacci sequence. We refer to a series of numbers derived this way as Fibonacci numbers.
We can go back to the beginning and divide one number by its adjacent number -- so 1�1 is 1.0, 1�2 is .5, 2�3 is .667, and so on. If we keep doing that all the way to infinity, that ratio approaches the number .618. This is called the Golden Ratio, represented by the Greek letter phi (pronounced "fie"). It is an irrational number, which means that it cannot be represented by a fraction of whole integers. The inverse of .618 is 1.618. So, in other words, if we carry the series forward and take the inverse of each of these numbers, that ratio also approaches 1.618. The Golden Ratio, .618, is the only number that will also be equal to its inverse when added to 1. So, in other words, 1 plus .618 is 1.618, and the inverse of .618 is also 1.618.
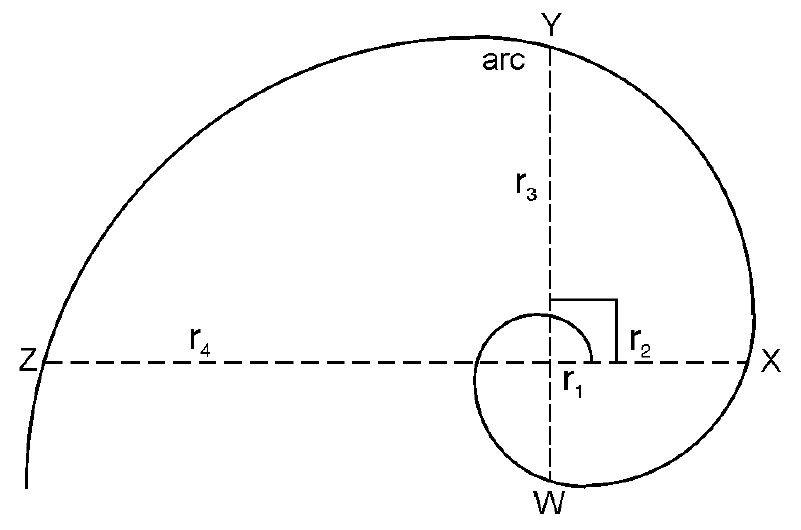
This is a diagram of the Golden Spiral. The Golden Spiral is a type of logarithmic spiral that is made up of a number of Fibonacci relationships, or more specifically, a number of Golden Ratios. For example, if we take a specific arc and divide it by its diameter, that will also give us the Golden Ratio 1.618. We can take, for example, arc WY and divide it by its diameter of WY. That produces the multiple 1.618. Certain arcs are also related by the ratio of 1.618. If we take the arc XY and divide that by arc WX, we get 1.618. If we take radius 1 (r1), compare it with the next radius of an arc that�s at a 90� angle with r1, which is r2, and divide r2 by r1, we also get 1.618.
Fibonacci-Based Behavior in Financial Markets
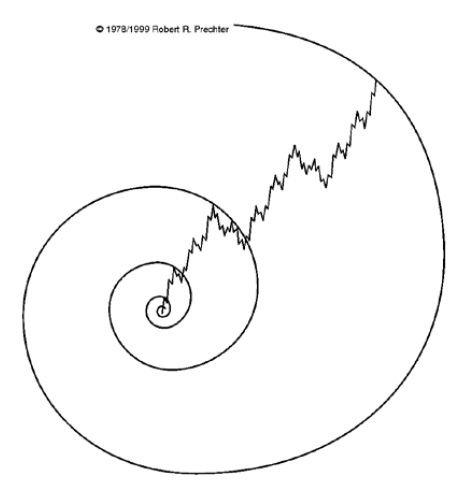
We can visualize that the stock market or financial markets are actually spiraling outward in a sense. This is a diagram of the stock market whereby the top of each successive wave of higher degree (in terms of the Wave Principle) becomes the touch point of an exponential expansion or logarithmic spiral. We can actually visualize the market in this sense, and we will see later on, in terms of Fibonacci ratios and multiples, how this unfolds.
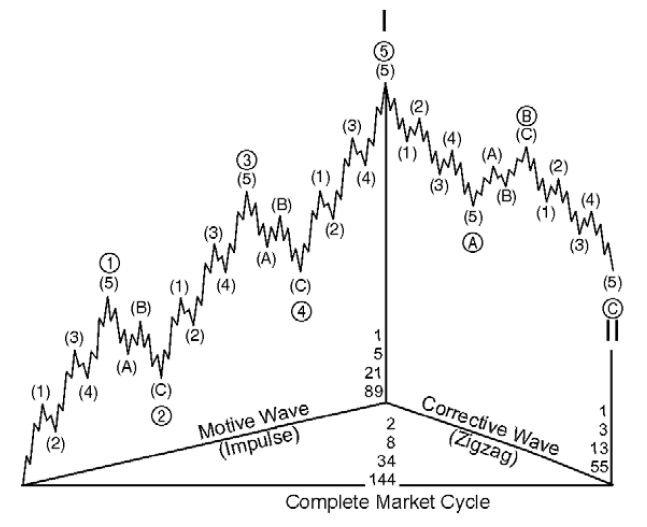
This is a diagram of the Elliott wave pattern. It is a typical diagram showing us the higher degree in Roman numerals with wave I up (motive) and wave II down (corrective). One of the connections to Fibonacci ratios and numbers is that with Elliott wave, if we look at how many waves there are within each wave, we end up with Fibonacci numbers.
|
Learn How You Can Use Fibonacci to Improve Your Trading If you'd like to learn more about Fibonacci and how to apply it to your trading strategy, download the entire 14-page free eBook, How You Can Use Fibonacci to Improve Your Trading. EWI Senior Tutorial Instructor Wayne Gorman explains:
See how easy it is to use Fibonacci in your trading. Download your free eBook today >> |

This article was syndicated by Elliott Wave International and was originally published under the headline Applying Fibonacci to Stock Market Patterns. EWI is the world's largest market forecasting firm. Its staff of full-time analysts led by Chartered Market Technician Robert Prechter provides 24-hour-a-day market analysis to institutional and private investors around the world.
About the Publisher, Elliott Wave International Founded in 1979 by Robert R. Prechter Jr., Elliott Wave International (EWI) is the world's largest market forecasting firm. Its staff of full-time analysts provides 24-hour-a-day market analysis to institutional and private around the world.
© 2005-2022 http://www.MarketOracle.co.uk - The Market Oracle is a FREE Daily Financial Markets Analysis & Forecasting online publication.