Key Intermarket Forex Pairs and Bond Market Charts Analysis
Stock-Markets / Financial Markets 2012 Jan 31, 2012 - 07:53 AM GMTBy: Capital3X
 Yesterday saw a major short squeeze on S&P500 as wrenched out the shorts who got in short on the market too early. There is a time to short and the trader who can learn the art of timing has mastered it. Having said that, not even 1% can consistently time the market over a 200 day trading period.
This is part of the premium update which we share with our subscribers on a daily basis. Part of it is shared here. We will look at key intermarket forex pairs and bond market charts to understand price action. We will also look at an important macro data point released yesterday.
First up is AUD/JPY:
AUD/JPY
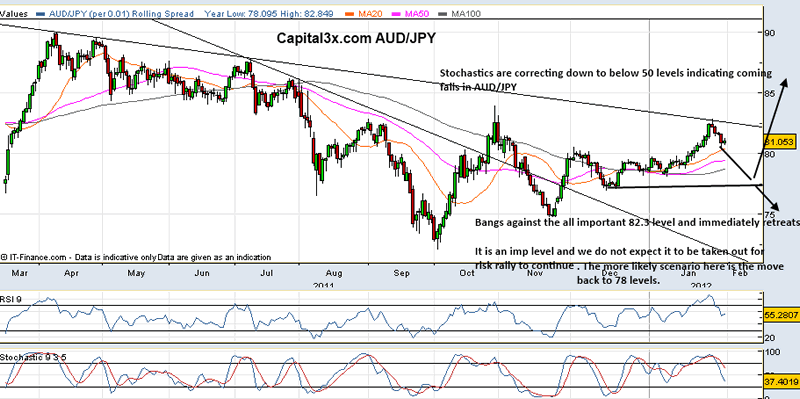
Strong bunds and falling yields have made YEN more powerful than any currency. AUD is the king of risk trades. When two titans meet, the outcome will decide the dominant trend. Needless to say the winner here till now is still the YEN. AUDJPY on the charts above needs to take out 82.3 level which we expect to be taken out in 2012 (in keeping with our premium analysis dated 30 Jan 2012), is facing immediate headwinds as it fights of at 81 levels.
ES Charts
Commentary
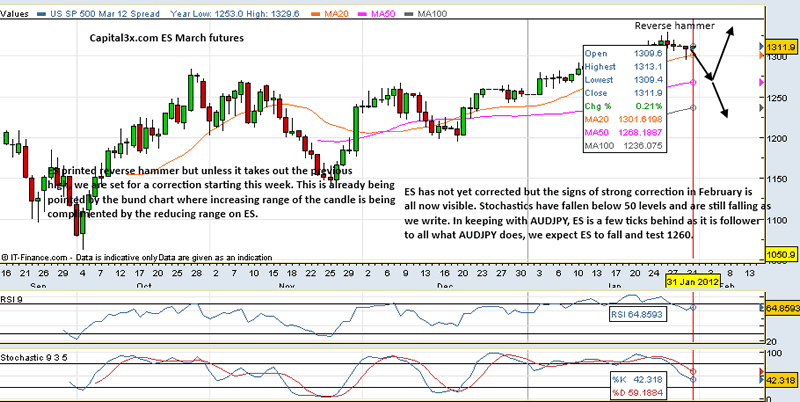
The 30000 ft view still does not change. Markets have no more fuel left and unless it makes a structured move down to support zones at 1290 and then 1260 zone, there could be a case for crash landing which will hurt. Given the liquidity sloshing around, markets are finding it difficult to go below 1300 but once below should see traders reverse position and algo running reverse gear.
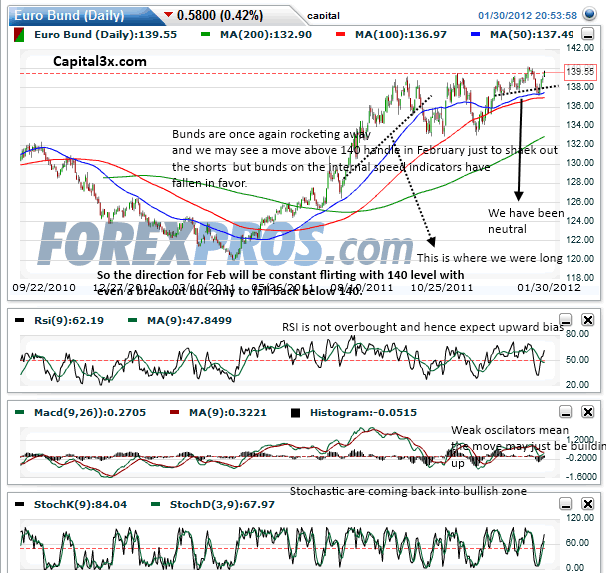
Bunds still testing out 140 and easing temporarily. In keeping with upward bias for February while being in a larger topping formation, we are setting for some nice long trades above 139 levels.
FX Setups
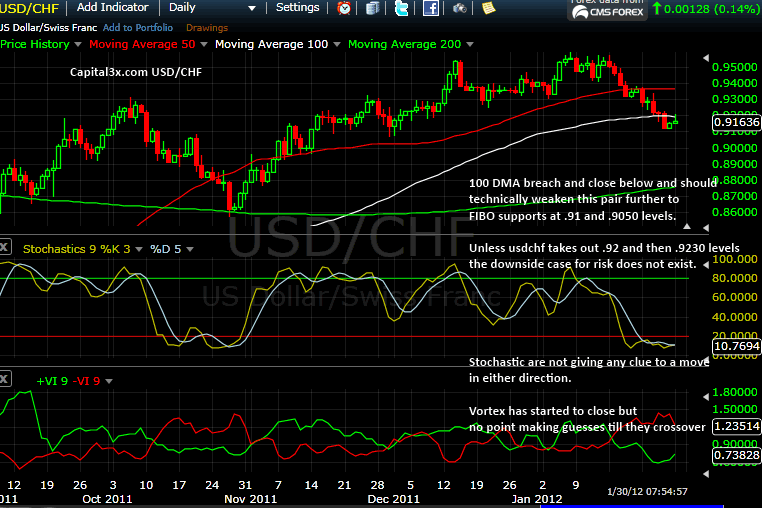
USDC/CHF: The bullish case will impose the downside for the Risk
USDCAD: CAD will not let it go
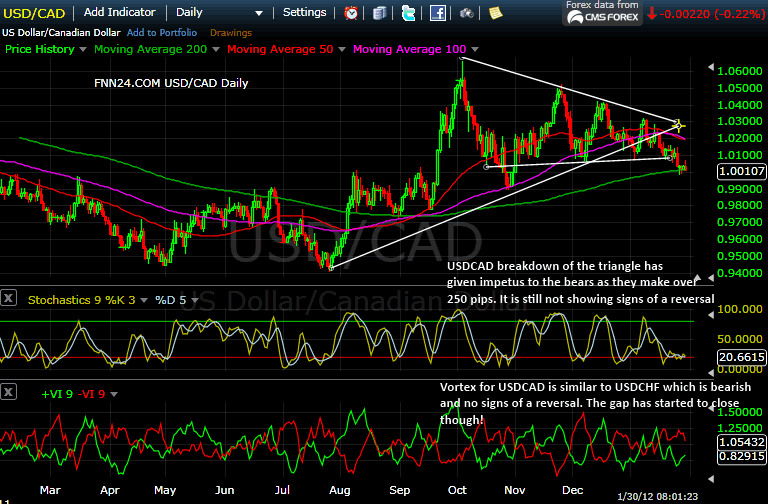
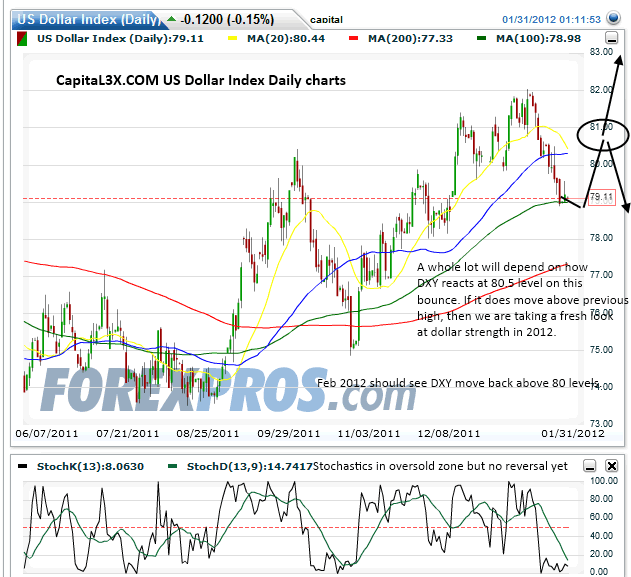
Dollar Charts
Bonds schedule for today
31-Jan-12 1000 EU ECB’s 7-day Refinancing Operation
31-Jan-12 1030 BE Auction EUR 3 bn EUR 3bln 3-, & 6-month T-Bill Auction
31-Jan-12 1200 EU ECB’s Liquidity Draining Operation
31-Jan-12 1445 UK Purchase GBP 1.7 bn BoE Asset Purchase Facility GBP 1.7bln 2038-2060 Gilt Purchases
31-Jan-12 1600 US Purchase Fed’s Outright Trea. Coup. Purch. Feb’36-Nov’41 (USD 2.25-2.75bln)
31-Jan-12 1630 US Auction USD 30 bn USD 30bln 4-Week T-Bill Auction
31-Jan-12 1900 US Fed’s Outright operation schedule announcement
Bunds and ES: Early warnings
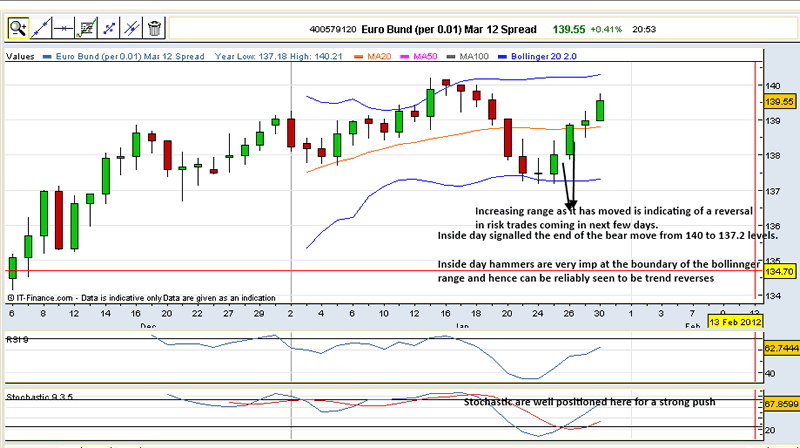

All commentaries on the charts.
As usual bonds are giving us reversal signals, sometimes a bit too early. It is also being validated by the AUD/JPY in the charts here. Click here. Also further setups were shared here. Bond and FX setups
Macro News
The Economic Sentiment Indicator for the euro zone climbed in January for the first time in ten months, from a revised 92.8 to 93.4. This is another sign pointing to an end to the recession in spring. But this applies only to the euro zone economy as a whole. The economies of the peripheral countries will continue to face a contraction.
But the ESI’s first rise since February 2011 turned out smaller than expected (consensus: 93.8). Business confidence in the service sector improved markedly (-0.6, up from -2.6), whilst sentiment in industry remained flat (-7.2).
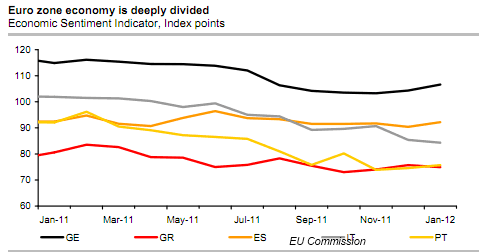
Following the purchasing managers’ indices, the ESI, too, has stopped its nosedive. This confirms our expectation that the recession in the euro zone will end in spring. But this applies only to the euro zone economy as a whole. It is too early to sound the all-clear for the periphery. The strict austerity measures in these countries continue to impose a heavy burden on the economy.

The ESI still indicates a sharp recession for Greece and Portugal (chart). In Italy, too, the trend is still down. Even if the euro zone economy stops contracting in spring, we are not reckoning with an upturn later in the year. We still expect GDP to contract in 2012. The basis for assumed contraction in EU economy is in case a flare of the debt crisis happens in 2012, then GDP faces major downside risks. The poker game about the second aid package for Greece still continues. If the country receives no fresh money, it will be insolvent by 20 March at the latest, when the Greek finance minister has to repay a bond with a volume of €14bn. Fear of contagion spreading to other euro zone countries is still running high. The risk premium for Portuguese government bonds has surged to new all-time highs. Nor can the other peripheral countries feel safe. Against the backdrop of the recession, many of them will fail to reach their deficit targets also in 2012. Investors will remain mistrustful.
EURCHF is nearing an important barrier and if taken out at 1.2050, we are in eye ball to eye ball with the SNB. The market direction will determine the general market direction for February. The last time they intervened in Sept 2011, triggered a massive risk aversion wave in Sept and then in Nov 2011.
Charts and commentaries added below.
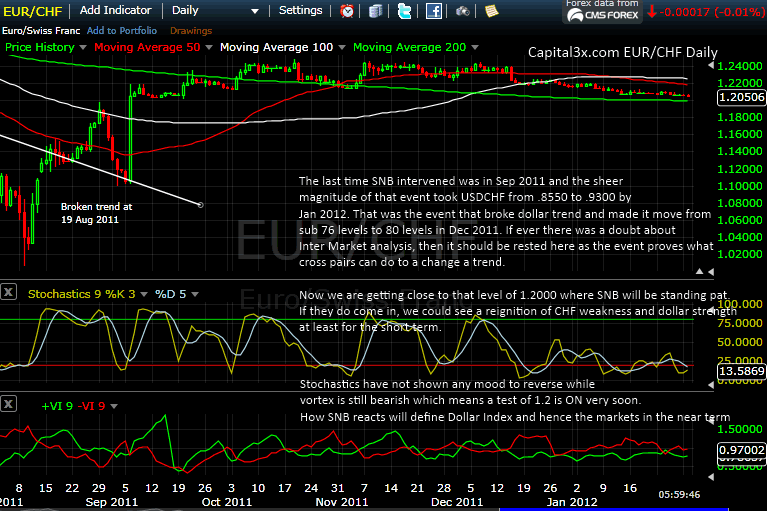
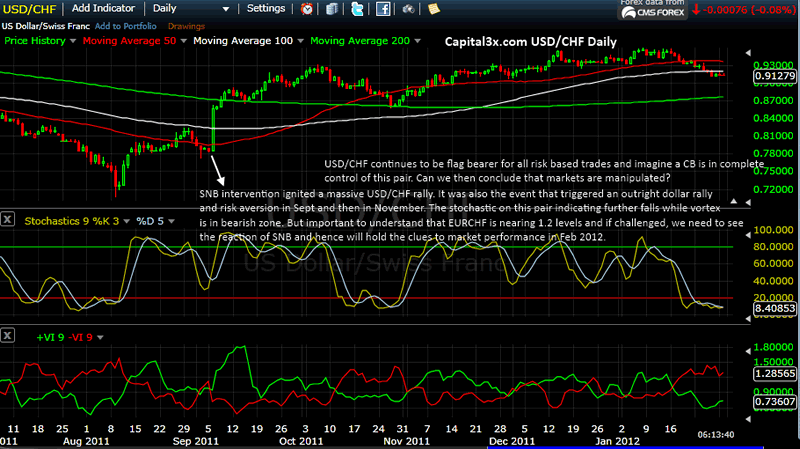
All commentaries on the charts.
These are only part of the constant analysis being sent to regular subscriber of Capital3x. Capital3x has focused on out of the box analysis and research to provide cutting edge performance on their trading portfolio over the last 6 months.
The Performance can be viewed here: Performance
We continue to watch the price action and will update our premium subscribers with new analysis and charts. Our trade portfolio (Forex, SPX Emini, Crude, Gold, Silver) is visible to our premium subscribers
Our feeds: RSS feed
Our Twitter: Follow Us
Kate
Capital3x.com
Kate, trading experience with PIMCO, now manage capital3x.com. Check performance before you subscribe.
© 2012 Copyright Capital3X - All Rights Reserved
Disclaimer: The above is a matter of opinion provided for general information purposes only and is not intended as investment advice. Information and analysis above are derived from sources and utilising methods believed to be reliable, but we cannot accept responsibility for any losses you may incur as a result of this analysis. Individuals should consult with their personal financial advisors.
© 2005-2022 http://www.MarketOracle.co.uk - The Market Oracle is a FREE Daily Financial Markets Analysis & Forecasting online publication.


