Gold ETFs and Stocks Major Uptrend Just Starting
Commodities / Gold and Silver 2012 Jan 30, 2012 - 03:56 AM GMTBy: Clive_Maund
 This Gold Market update is going to be short and to the point for 2 reasons. One is that I am too busy writing up stocks for subscribers to devote much time to the world at large - they are being written up as fast as possible, for reasons that will become obvious as you read on. The other reason is that for the 1st time in many months, the situation is nice and clear, and doesn't require a time wasting diatribe.
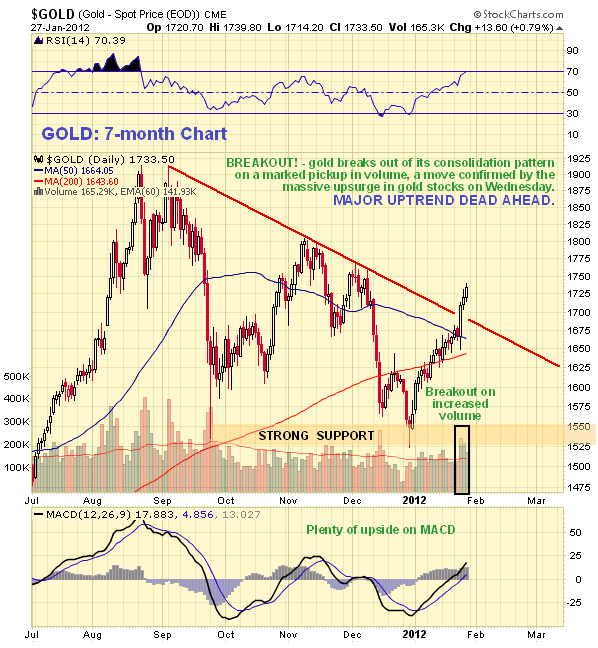
On the 7-month chart for gold we can see that on Wednesday it broke out from the consolidation pattern that it has been stuck in since it peaked last August-September. This was a strong move on significantly increased turnover, which is bullish, and was a move confirmed by a massive upblast by PM stocks. This breakout is therefore viewed as marking the end of what has turned out to be a period of consolidation, and the start of a major uptrend that should take gold MUCH higher - comfortably to new highs.
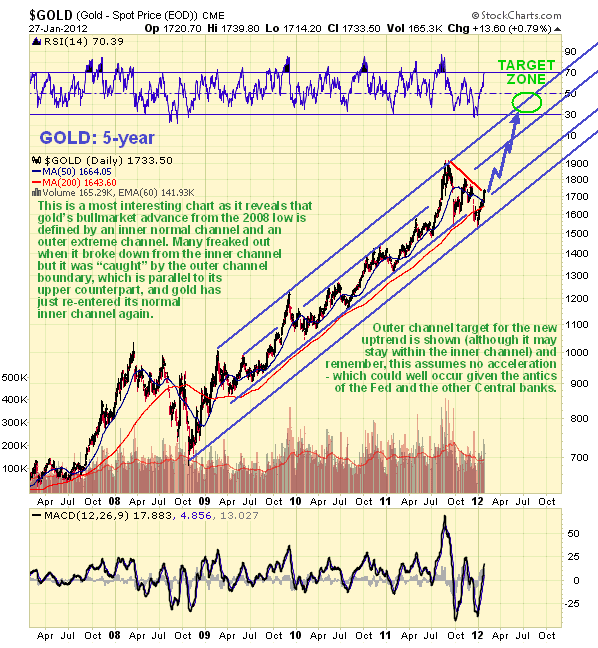
The 5-year chart for gold is most interesting as it reveals that its bullmarket advance from the 2008 low is defined by an inner normal channel, and an outer extreme one. As we can see, the recent recovery from the December lows has defined the lower boundary of the outer channel for the 1st time, and it is interesting to observe how the already defined upper channel boundary could have been used to predict the exact low in gold at its recent bottom. Not only has this parallel outer boundary held, but with last week's breakout, the price has regained a foothold back within the inner channel this past week, and now, having broken out from its downchannel in force from September, it is in position to advance towards the upper channels boundaries again. The target zone given assumes that it will make a run at the outer channel boudary again - but it may instead be content to advance within the confines of the inner channel, which will still result in new highs and very worthwhile gains from here.
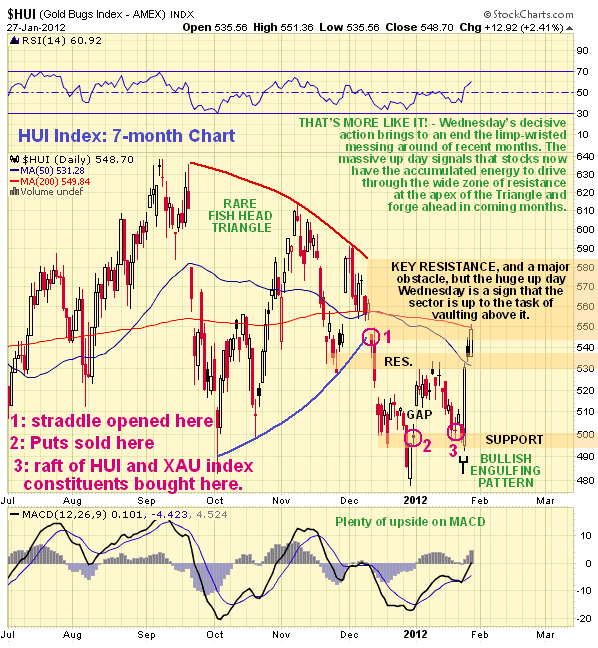
Although PM stocks have not yet broken out - to do that they will have to rise clear above the broad zone of resistance at the apex of the Fish Head Triangle in the indices that they broke down from in December, shown on the 7-month chart for the HUI index shown below - the massive up day on Wednesday is a sign that they have gathered the strength to do just that, and the fact that this up day occurred as gold broke out upside is of course no coincidence.
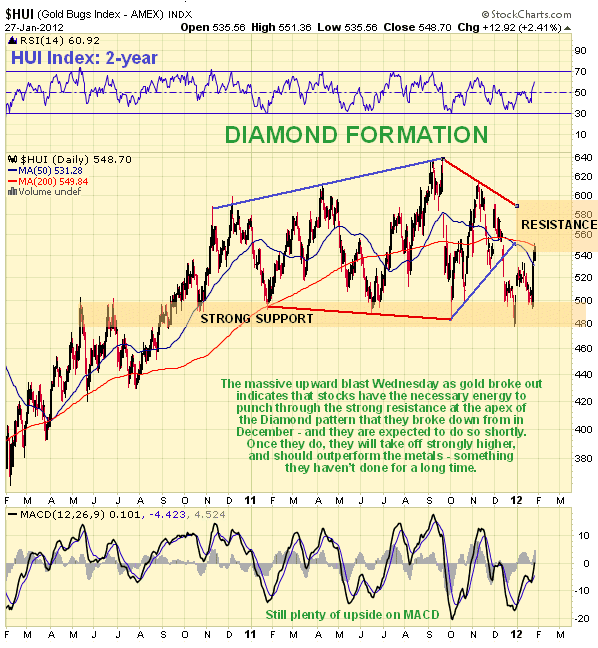
The Fish Head Triangle makes up the final stages of a large Diamond pattern that can be seen to advantage on the 2-year chart for the HUI index (it is also evident on the GDX chart). Diamond patterns are normally, although not always, bearish, which is a big reason why we were wary earlier, but in this modern age of market manipulation and meddling, politicians are not prepared to give the forces of capitalism free rein to do their necessary work of straightening out distortions, since that conflicts with their agenda. Thus, instead of letting European banks collapse, the Fed has decided to rescue them with "back door" QE dressed up as swaps etc - the reason is, as you might expect, not altruistic - if the European banks collapse, they will drag down the US banks, and as the US banks are the Fed's masters and the bosses of the entire system, that cannot be allowed to happen, whatever the cost elsewhere. That is why the markets are rallying again across a broad front and why the outlook for gold and silver, and commodities generally, is once again bright, for the European bailout means money creation - and inflation.
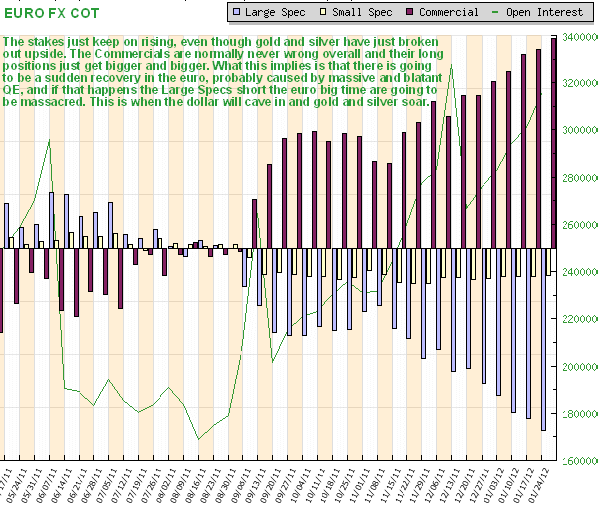
The breakouts in gold and silver are bad news for the dollar - and that implies a recovery in the euro. Thus it is interesting to observe that a lot of market players are still gambling on an all-out collapse by the euro, if the latest COT chart for the euro fx, shown below, is anything to go by. One thing is for sure, it isn't the Commercials gambling on a collapse in the euro - just the opposite, so once again it looks like the hapless Large Specs have set themselves up to be royally fleeced. This COT chart looks like the final stages of a big tuna hunt where the nets are pulled together and the catch is finally hauled aboard.
Conclusion - a major uptrend is just starting in gold, gold ETFs and Precious Metals stocks. Good time to buy if you haven't already
By Clive Maund
CliveMaund.com
For billing & subscription questions: subscriptions@clivemaund.com
© 2012 Clive Maund - The above represents the opinion and analysis of Mr. Maund, based on data available to him, at the time of writing. Mr. Maunds opinions are his own, and are not a recommendation or an offer to buy or sell securities. No responsibility can be accepted for losses that may result as a consequence of trading on the basis of this analysis.
Mr. Maund is an independent analyst who receives no compensation of any kind from any groups, individuals or corporations mentioned in his reports. As trading and investing in any financial markets may involve serious risk of loss, Mr. Maund recommends that you consult with a qualified investment advisor, one licensed by appropriate regulatory agencies in your legal jurisdiction and do your own due diligence and research when making any kind of a transaction with financial ramifications.
Clive Maund Archive |
© 2005-2022 http://www.MarketOracle.co.uk - The Market Oracle is a FREE Daily Financial Markets Analysis & Forecasting online publication.


