


Is World Trade Falling Like A Lead Balloon Minus Terminal Velocity? Alarming Collapse of Baltic Dry Index
Economics / Recession 2012 Jan 30, 2012 - 03:32 AM GMTBy: BATR

 Significance of BDI
Is the Baltic Dry Index (BDI) one of the most significant leading economic indicators to follow when the media is telling us the global economy is looking great one week and then predicting a double dip recession the next? We are increasingly concerned about the substantial decline in global shipping’s Baltic Dry Index. Is this a significant canary in the mine shaft in regard to what lies ahead for world trade dynamics, global aggregate demand and trans-national economic and financial activity?
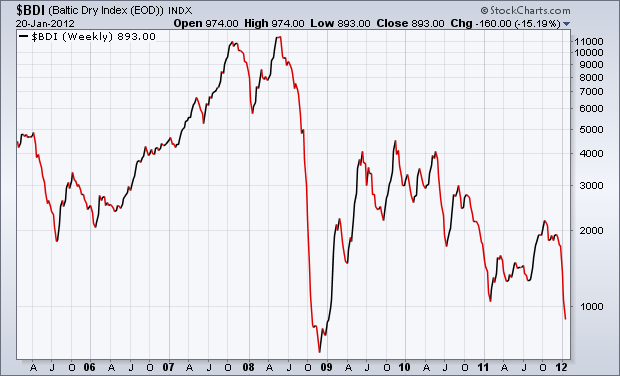
Baltic Dry Index (BDI) over Seven Years on a Logarithmic Scale
Alarming Fall
With immediate effect, we are advising chairmen and CEOs of major corporations and financial institutions in 120 countries around the world as well as parliamentarians, central bankers and regulators not to ignore the alarming non-stop fall in the somewhat obscure, yet instructive Baltic Dry Index (BDI) -- also known as Dry Bulk Shipping -- over the last one month in particular and in the last three months in general. [Reference Analysis: mi2g Intelligence Unit (miU) and the ATCA 5000 Research and Analysis Wing (A-RAW)]
Decline > 50% in One Month
Since the beginning of 2012, the Baltic Dry Index (BDI) has fallen very steeply to 726 as of Friday, January 27th, 2012, a level not seen since the depths of The Great Reset which began in late 2008. By comparison, over the last ten years the Baltic Dry Index has averaged approximately between 2,500 and 2,750. BDI is down more than 50% in the last month and down more than 55% in the last three months!
Shipping Capacity
Our super-computing visualisation and analysis of BDI data sets over 20 years suggests that when the Baltic Dry Index falls by more than 25% in a given month, global economic activity is either already decreasing or about to decrease -- regardless of the media chatter by so called economic experts and talking heads on television about increased shipping capacity. Although new fuel efficient engine technologies have made older shipping redundant, and this in turn has triggered an unprecedented 12% expansion of the shipping fleet in 2012 as these new vessels come on line, however, the primary cause of a more than 50% decline in BDI in one month cannot be attributed to increases in global shipping capacity alone. Why? Increases in the supply of global shipping capacity are not large enough to explain such a substantial plunge in BDI within one month. BDI collapse is also closely coupled to simultaneous decline in global demand.
Liquidity versus Illiquidity
A key point to note is that the BDI is a leading indicator of economic activity but not necessarily a leading indicator of consistently rising or falling financial markets -- just more liquid or less liquid markets, due to better or worse economic conditions. In less liquid markets, falls can be quite exaggerated, as sellers wish to sell to virtually non-existent or vanishing buyers. As such, when BDI is falling, it appears to precede decreased liquidity in equities, falling commodity prices, falling interest rates and falling commodity based currencies such as the Australian and Canadian dollar.
Raw Material Cargoes
BDI tracks the cost of shipping major raw material dry bulk cargoes by sea including grain, iron ore, coal and other fossil fuels, cement, copper, sand and gravel, fertilizer and even plastic granules. Changes in the BDI are often tracked by investors to measure changes in the demand for different commodities around the globe. Basically, it is an indication of shipping demand against the available worldwide fleet of dry bulk ships. The steelmaking raw material constitutes the largest source of demand for dry-bulk shipping.
China and Seasonality
China is by far the world’s biggest consumer and importer of commodities and therefore the biggest player in dry bulk shipping demand. Seasonally weak periods in the China economy may lead to low physical demand for commodities and therefore lower freight demand. The present plunge in the BDI indicates major weakening in the China economy, which is one of the leading consumers of raw materials both for construction of mammoth infrastructure and large-scale supplier of consumer products worldwide. Historically, strong periods in the Chinese economy have led to high freight demand and a higher BDI. China’s New Year Golden Week holiday in January, which lasts for 15 days, coincides with and may provide one of the reasons for the weak seasonal pattern of the BDI in January/February. Given the China-centric commodities tilt of BDI, the substantial plunge suggests that a significant slowdown is occurring in regard to the China economy and its consumption of raw materials -- over and above the New Year celebrations trough -- on the back of reduced global demand for its exports and a slowdown in domestic construction activities.
Unique Index
BDI is issued daily by the UK-based Baltic Exchange which has been in existence since 1744. Simply put, BDI tracks the precursors of economic output and, as such, provides a measurement of the volume of global trade at the earliest possible stage. BDI is one of the very few leading, non-speculative, non-revisable economic measures, unlike GDP growth, unemployment and consumer sentiment measures, all of which are lagging indicators.
What Happened Last Time?
The BDI hit an all-time high of 11,793 on May 20th, 2008, when borrowing money was still relatively easy and excess was the name of the game. As The Great Unwind became entrenched in the world's economy and The Great Reset caused world trade to collapse in Q4 2008, partially because of the Lehman Brothers bankruptcy, BDI fell to a low of 663 on December 4th, 2008, ie, a drop of 94%, when the BDI hit a 20 year low. Not surprisingly, the bottom of the ‘Great Recession’ was hit shortly thereafter!
Conclusion
The Baltic Dry Index’s recent collapse reflects a substantial plunge in shipping rates as demand for shipping by sea plummets around the world. This precipitous drop in the BDI may well be a harbinger of tough times ahead. Conversely, it could indicate an aberration in the historically inelastic supply curve of shipping. Whichever way one reads it, however, the volatility in such an important index as the BDI is something to be concerned about.
Key Questions
1. Are we now witnessing a repeat in the slow-down of world trade on a somewhat unprecedented scale last seen in Q4 2008?
2. If world trade is falling dramatically what does it portend for export dependent economies including advanced economies like Japan and Germany and most emerging market economies including China, India and Brazil?
3. Are there ways in which national economies can incentivise their investment and consumption patterns to generate domestically driven growth?
What are your thoughts, observations and views? We are hosting an Expert roundtable on this issue at ATCA 24/7 on Yammer.
By DK Matai
Asymmetric Threats Contingency Alliance (ATCA) & The Philanthropia
We welcome your participation in this Socratic dialogue. Please access by clicking here.
ATCA: The Asymmetric Threats Contingency Alliance is a philanthropic expert initiative founded in 2001 to resolve complex global challenges through collective Socratic dialogue and joint executive action to build a wisdom based global economy. Adhering to the doctrine of non-violence, ATCA addresses asymmetric threats and social opportunities arising from climate chaos and the environment; radical poverty and microfinance; geo-politics and energy; organised crime & extremism; advanced technologies -- bio, info, nano, robo & AI; demographic skews and resource shortages; pandemics; financial systems and systemic risk; as well as transhumanism and ethics. Present membership of ATCA is by invitation only and has over 5,000 distinguished members from over 120 countries: including 1,000 Parliamentarians; 1,500 Chairmen and CEOs of corporations; 1,000 Heads of NGOs; 750 Directors at Academic Centres of Excellence; 500 Inventors and Original thinkers; as well as 250 Editors-in-Chief of major media.
The Philanthropia, founded in 2005, brings together over 1,000 leading individual and private philanthropists, family offices, foundations, private banks, non-governmental organisations and specialist advisors to address complex global challenges such as countering climate chaos, reducing radical poverty and developing global leadership for the younger generation through the appliance of science and technology, leveraging acumen and finance, as well as encouraging collaboration with a strong commitment to ethics. Philanthropia emphasises multi-faith spiritual values: introspection, healthy living and ecology. Philanthropia Targets: Countering climate chaos and carbon neutrality; Eliminating radical poverty -- through micro-credit schemes, empowerment of women and more responsible capitalism; Leadership for the Younger Generation; and Corporate and social responsibility.
© 2012 Copyright DK Matai - All Rights Reserved Disclaimer: The above is a matter of opinion provided for general information purposes only and is not intended as investment advice. Information and analysis above are derived from sources and utilising methods believed to be reliable, but we cannot accept responsibility for any losses you may incur as a result of this analysis. Individuals should consult with their personal financial advisors.
© 2005-2022 http://www.MarketOracle.co.uk - The Market Oracle is a FREE Daily Financial Markets Analysis & Forecasting online publication.