


Gold Trend Forecast for Q1 2012
Commodities / Gold and Silver 2012 Jan 16, 2012 - 10:52 AM GMTBy: Chris_Vermeulen

 Over the past five months gold has fallen sharply and is no longer headline news which it once dominated back in 2011 when it was making new highs every day. The shiny metal has been under pressure because traders and investors started to pull some money off the table to lock in gains. Gold prices had surged so fast most advanced traders knew that final high volume surge was not sustainable. But the main reason gold topped out in my opinion was because the US Dollar index had put in a bottom and started to build a base. As we all know a rising dollar typically means lower stocks and commodity prices.
I have posted some charts below covering gold in detail using multiple time frames. The weekly which is long term, daily which is the intermediate trend and the 4 hour chart which shows gold momentum and intraday action. At the very bottom I talk about the US Dollar and what is happening with that.
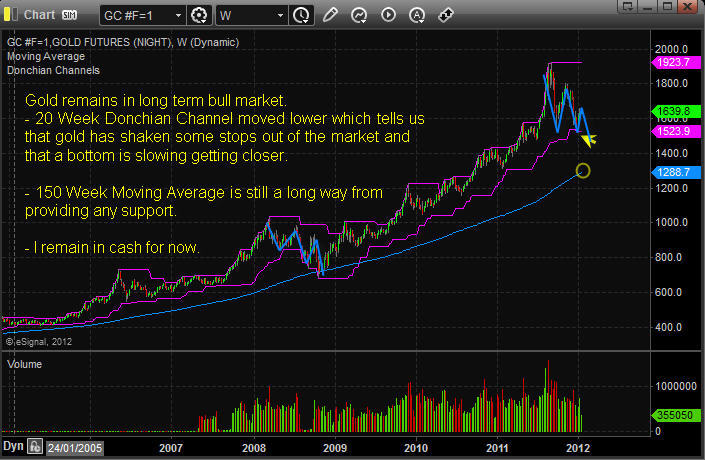
Gold Weekly Long Term Trend Analysis
The weekly chart is not the most exciting time frame to follow as you will grow old watching it. That being said it is crucial for understanding the long term trend, price and volume analysis.
Below you can see that gold’s recent pullback has been a 3 wave correction, which is a normal pullback for any investment. But taking into account the rally from 2008 – 2011 I feel this pullback will have one more low put in before bottoming out. This would make for a 5 wave correction much like what happened in 2008.
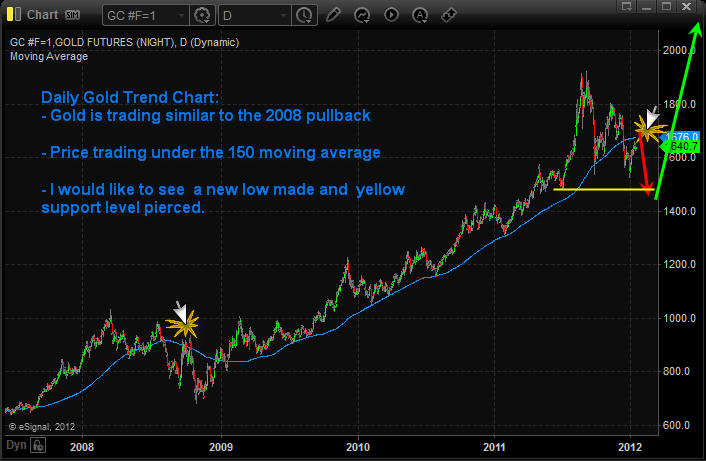
Daily Chart of Gold Showing the Intermediate Trend
The daily chart allows us to see gold intra-week price action and use the 150 moving average which is my preferred daily moving average. As you can see we are getting a similar pullback as 2008 with gold now trading under the 150 MA.
I would like to see gold make another lower low in the next 2-3 months. If that happens I feel it complete the correction and trigger a strong multi month or multiyear rally in gold.
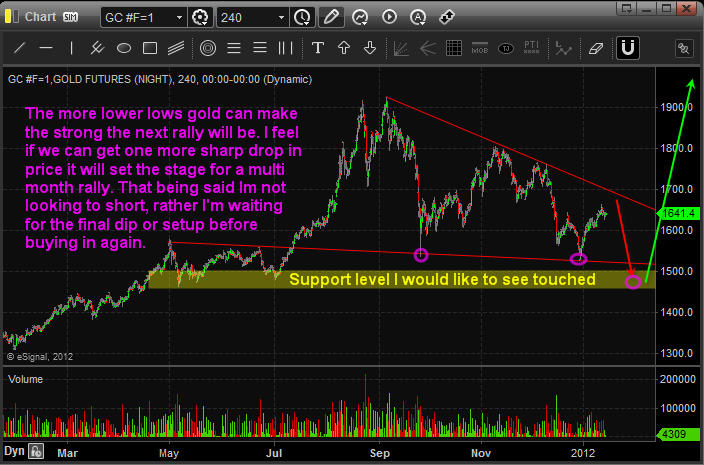
4 Hour Intraday Chart of Gold
The 4 hour chart of gold allows us to see all the intraday price action which would normally not be seen with a daily chart. It also gives us enough data to build our analysis upon.
My preferred setup for gold which I feel if happens will trigger major buying in the yellow metal. If/when we get a rally in gold would also likely mean some more economic uncertainty has entered the market either from within the USA, Europe or China…
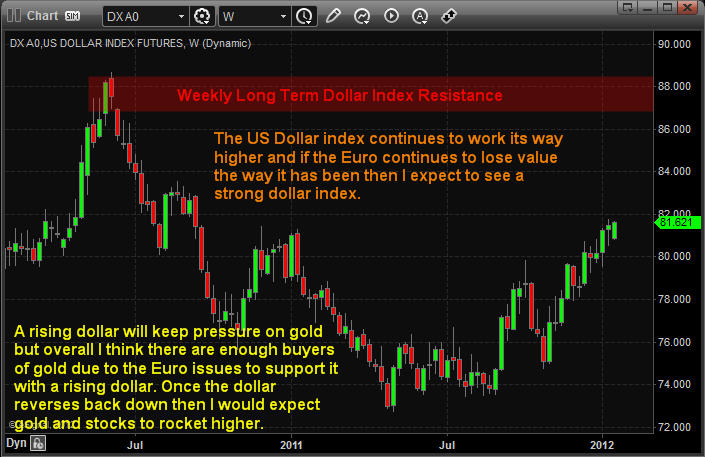
Weekly Dollar Index Long Term Analysis
The dollar has the potential to rally to the 87 – 88 level before putting in a major top. For this to happen we will need to see the Euro crumble (both currency and countries divide) in my opinion.
If you look at the weekly chart of gold and this chart of the dollar index you will notice that gold topped when the dollar bottomed. Over the past couple year’s gold and the dollar have had an inverse relationship to each other.
With all kinds of crap about to hit the fan overseas I think it’s very possible gold will rally with the dollar. Reason being there is way more people overseas who want to unload their euro’s and with all the negative talk and doubt with the US Dollar individuals will naturally want to buy more gold.
Weekend Trend Trading Conclusion:
In short, I expect a bumpy ride for both stocks and commodities in the first quarter of 2012. With any luck gold will pull back into my price zone shaking the majority of short term traders out just before it bottoms. And we will be positioning ourselves for a strong rally buying into their panic selling.
To just touch base on the general stock market quickly. I have a very bearish outlook for stocks. If the dollar continues to rise it is very likely the stock market will fall into a bear market. So I am VERY cautious with stock at this time.
If you would like to receive my Weekly reports, updates and trading education videos each week join my free newsletter here: www.GoldAndOilGuy.com
Get My FREE Weekly Newsletter Here: http://www.GoldAndOilGuy.com/
By Chris Vermeulen
Chris@TheGoldAndOilGuy.com
Please visit my website for more information. http://www.TheGoldAndOilGuy.com
Chris Vermeulen is Founder of the popular trading site TheGoldAndOilGuy.com. There he shares his highly successful, low-risk trading method. For 6 years Chris has been a leader in teaching others to skillfully trade in gold, oil, and silver in both bull and bear markets. Subscribers to his service depend on Chris' uniquely consistent investment opportunities that carry exceptionally low risk and high return.
This article is intended solely for information purposes. The opinions are those of the author only. Please conduct further research and consult your financial advisor before making any investment/trading decision. No responsibility can be accepted for losses that may result as a consequence of trading on the basis of this analysis.
Chris Vermeulen Archive |
© 2005-2022 http://www.MarketOracle.co.uk - The Market Oracle is a FREE Daily Financial Markets Analysis & Forecasting online publication.