Most Popular
1. It’s a New Macro, the Gold Market Knows It, But Dead Men Walking Do Not (yet)- Gary_Tanashian
2.Stock Market Presidential Election Cycle Seasonal Trend Analysis - Nadeem_Walayat
3. Bitcoin S&P Pattern - Nadeem_Walayat
4.Nvidia Blow Off Top - Flying High like the Phoenix too Close to the Sun - Nadeem_Walayat
4.U.S. financial market’s “Weimar phase” impact to your fiat and digital assets - Raymond_Matison
5. How to Profit from the Global Warming ClImate Change Mega Death Trend - Part1 - Nadeem_Walayat
7.Bitcoin Gravy Train Trend Forecast 2024 - - Nadeem_Walayat
8.The Bond Trade and Interest Rates - Nadeem_Walayat
9.It’s Easy to Scream Stocks Bubble! - Stephen_McBride
10.Fed’s Next Intertest Rate Move might not align with popular consensus - Richard_Mills
Last 7 days
Friday Stock Market CRASH Following Israel Attack on Iranian Nuclear Facilities - 19th Apr 24
All Measures to Combat Global Warming Are Smoke and Mirrors! - 18th Apr 24
Cisco Then vs. Nvidia Now - 18th Apr 24
Is the Biden Administration Trying To Destroy the Dollar? - 18th Apr 24
S&P Stock Market Trend Forecast to Dec 2024 - 16th Apr 24
No Deposit Bonuses: Boost Your Finances - 16th Apr 24
Global Warming ClImate Change Mega Death Trend - 8th Apr 24
Gold Is Rallying Again, But Silver Could Get REALLY Interesting - 8th Apr 24
Media Elite Belittle Inflation Struggles of Ordinary Americans - 8th Apr 24
Profit from the Roaring AI 2020's Tech Stocks Economic Boom - 8th Apr 24
Stock Market Election Year Five Nights at Freddy's - 7th Apr 24
It’s a New Macro, the Gold Market Knows It, But Dead Men Walking Do Not (yet)- 7th Apr 24
AI Revolution and NVDA: Why Tough Going May Be Ahead - 7th Apr 24
Hidden cost of US homeownership just saw its biggest spike in 5 years - 7th Apr 24
What Happens To Gold Price If The Fed Doesn’t Cut Rates? - 7th Apr 24
The Fed is becoming increasingly divided on interest rates - 7th Apr 24
The Evils of Paper Money Have no End - 7th Apr 24
Stock Market Presidential Election Cycle Seasonal Trend Analysis - 3rd Apr 24
Stock Market Presidential Election Cycle Seasonal Trend - 2nd Apr 24
Dow Stock Market Annual Percent Change Analysis 2024 - 2nd Apr 24
Bitcoin S&P Pattern - 31st Mar 24
S&P Stock Market Correlating Seasonal Swings - 31st Mar 24
S&P SEASONAL ANALYSIS - 31st Mar 24
Here's a Dirty Little Secret: Federal Reserve Monetary Policy Is Still Loose - 31st Mar 24
Tandem Chairman Paul Pester on Fintech, AI, and the Future of Banking in the UK - 31st Mar 24
Stock Market Volatility (VIX) - 25th Mar 24
Stock Market Investor Sentiment - 25th Mar 24
The Federal Reserve Didn't Do Anything But It Had Plenty to Say - 25th Mar 24

Market Oracle FREE Newsletter

How to Protect your Wealth by Investing in AI Tech Stocks

Did The Silver Bubble Burst?

Commodities / Gold and Silver 2012 Jan 10, 2012 - 03:52 AM GMT

By: Willem_Weytjens

Commodities

Diamond Rated - Best Financial Markets Analysis ArticleGold bugs argue that Gold is far from being a Bubble. Especially not when you look at the following comparison, which plots Gold’s rise versus the Nasdaq’s rise in the 1990's.
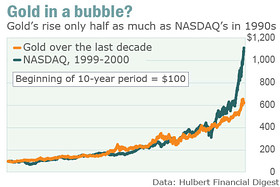

Chart: Marketwatch

The Bear Camp (including Nouriel Roubini for example), argue that Gold is (or was) a hyperbolic bubble that is about to (or already has?) burst:
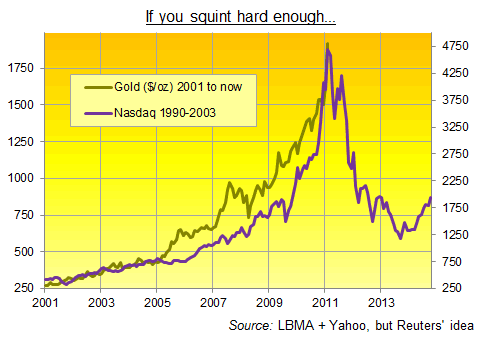
Chart: Forbes

I like comparisons because – although history doesn’t repeat exactly – I think it rhymes, and when I look at both charts seperately, I think both are very nice.

However, what if the Bulls are comparing the wrong asset to the Nasdaq Bubble? What if they should rather look at Silver prices?

Back in April, I felt silver was a Bubble, as price was going VERTICAL, which (as all good things) never lasts forever. The parabola burst in April, and usually, it takes a LONG time before the next move up will start (if it ever will).
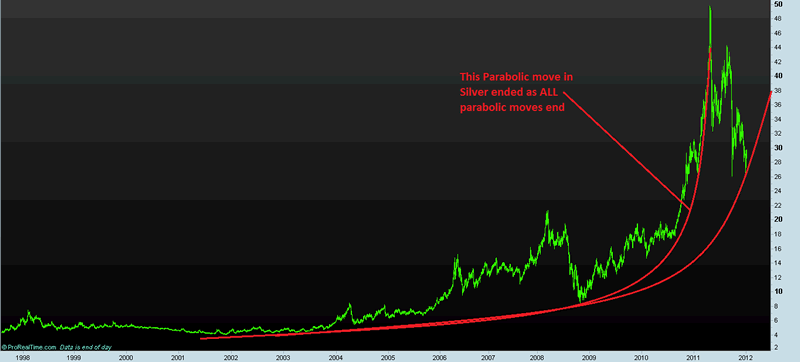
Chart courtesy Prorealtime.com

Now how is that related to the Nasdaq Bubble?

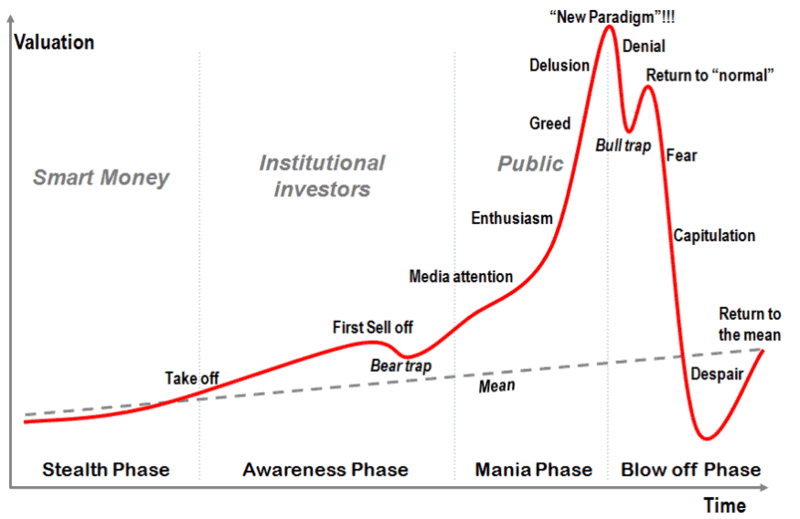
Let’s first look at how most (if not ALL) bubbles evolve.

* First, the Smart money comes in. They buy it because it’s undervalued, and they see a lot of potential. The markets are not aware of this.
* Second comes the insitutional money. The institutional investors are now also aware that the asset has a lot of potential.
After the nice run up, price corrects. Everybody says: this is the end of the bull market, but actually it’s a bear trap.
* When price resumes its uptrend, then comes the public: “look at what this asset has done over the last couple of years, it can definitely go higher”.
It starts with enthusiasm, then comes greed and eventually, we get a “New Paradigm”: Look at fundamentals, this is a 10 bagger from this point (forgetting that it already rose 10-fold).
Then the markets drop. The bulls say that it’s just a temporary correction after the huge run up over the last couple of years.
Then the markets rise again. The bulls will say: You see, the bull market has resumed. This is the Bull Trap.
When suddenly price falls below the previous low, the chartists get scared, and stoplosses are being hit. More selling follows. Now everybody panics. Then they capitulate: “I’ve had enough of this. I’m sick of it, I’m out”. Usually, price drops too much, too fast. Eventually, price returns back to the mean.
We can clearly see this pattern in the Nasdaq “Bubble” of the 1990's:
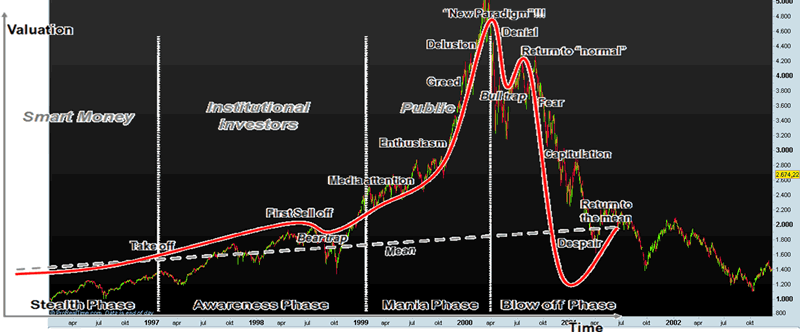
Chart courtesy Prorealtime.com

In fact, the Nasdaq is not the only “Bubble” of recent times that has burst. Think about the Chinese stock markets for example, hereby represented by FXI (iShares China 25 ETF). Do you see how similar FXI behaved to the NASDAQ (even AFTER the bubble had burst)?
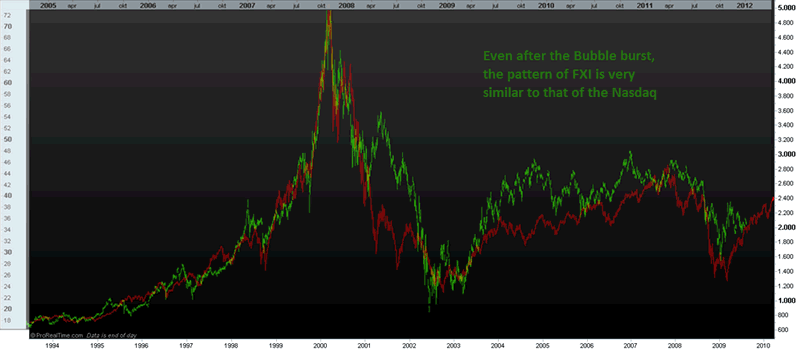
Chart courtesy Prorealtime.com

Now let’s have a look at the “Silver Bubble”. It’s following nearly EXACTLY the “Bubble Pattern” discussed above:
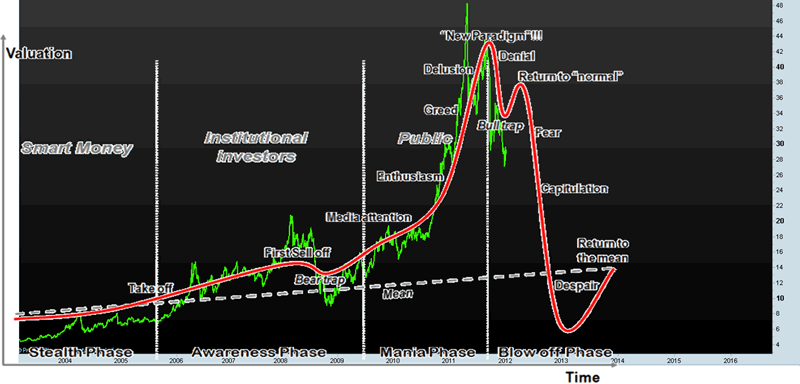
Chart courtesy Prorealtime.com

In fact, when we compare Silver to the Nasdaq, we get a much better comparison than when we compare Gold to the Nasdaq Bubble
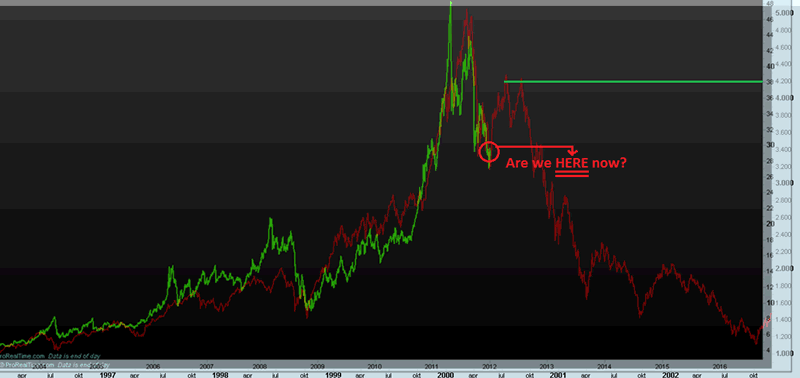
Chart courtesy Prorealtime.com

We might now get the “Bull Trap”, which means Silver might rise back towards $37-$39.
This would also be the target of the red channel in the following chart:
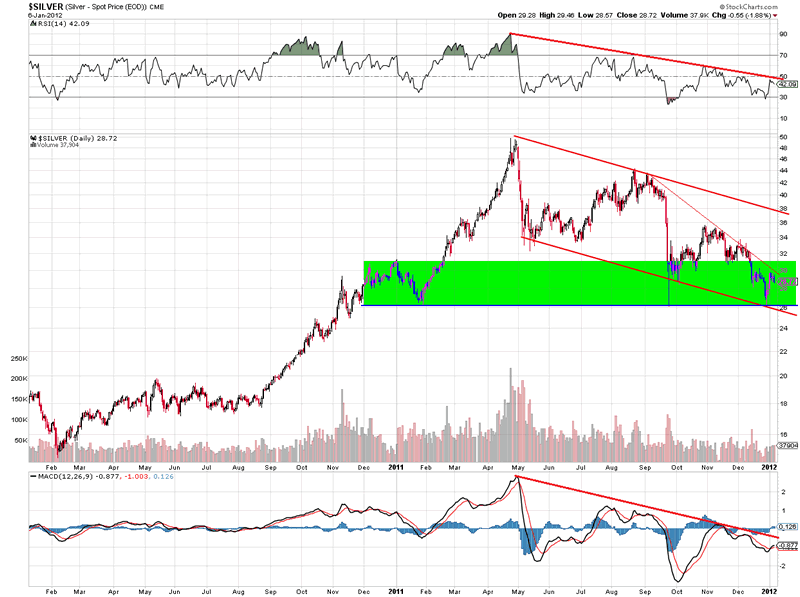
Chart courtesy stockcharts.com
When price hits that level, and then turns down, the last phase of this Bubble can start: Capitulation.

There is one sector which I believe is at or very close to forming a “post-Bubble” bottom.

For more analyses and trading updates, please visit www.profitimes.com

Willem Weytjens

www.profitimes.com

© 2012 Copyright Willem Weytjens - All Rights Reserved

Disclaimer: The above is a matter of opinion provided for general information purposes only and is not intended as investment advice. Information and analysis above are derived from sources and utilising methods believed to be reliable, but we cannot accept responsibility for any losses you may incur as a result of this analysis. Individuals should consult with their personal financial advisors.


© 2005-2022 http://www.MarketOracle.co.uk - The Market Oracle is a FREE Daily Financial Markets Analysis & Forecasting online publication.


Comments

Stephan
11 Jan 12, 00:49
Precious metal bull market

Looking at the gold bubble in the 70's you could have made the same argument when gold retraced from approximately $200 t0 $100 before going $850. I think more important is to see who is participating in Gold. Large funds like pension fund do not yet participate in gold ( with about 0.3% exposure). Also, go out on the street and ask 10 random people if they bought gold in the past 2 years or see if they can mention 3 gold mining stocks.

Looking back to the tech bubble or housing bubble - EVERYBODY could tell you the next great stock pick or the appreciation of their newly purchased property.

In the 70's gold had a 32 times price increase (from approx. $35 - $850). In this current bull market gold so far only had an approx. 8 time increase (from approx. $250 - $1930).

Although silver has more industrial use than gold, if the gold bull market is not over yet, the silver bull market is not yet over EITHER!


silverjesus
12 Jan 12, 21:51
08

lol you are saying the bubble burst yet this has happened 3 times before to silver in 04,06, and 08. exact same pattern too. go check your charts. the party just got started and you are about to leave when the girls cheerleading team shows up with weed and alcohol and a bunch of condoms. however al long as we are looking at bubbles lets take a look at 40 years of blowing up the fiat bubble or the 30 year rally in gov debt. now there is a bubble ready to burst. and when it does where do you think that money is going to go? metals wake up get a life you do this for a living and an amateur silver investor like me can school you with the greatest of ease. i am the realist thinking that fake fairy tale farmville digital zero's and ones printed up out of thin air will go to zero and not silver. you are the the one living in the fairy tale.


Kevin
12 Mar 12, 04:03
Nope

hindsight is 20/20, make another graph that stops in 08 or 06, they both also went vertical, and "crashed". Also If you rode the "bubble" of gold from 1970 to 1985 and you didn't pick the peak, you still would have made 15x your money. That's not a bubble.

The lack of the bubble really bursting has to do with the fact that the money supply increased so dramatically. And that's the fundamentals of why people are investing in gold/silver, and the price is rising.


Indicators dont lie
15 Mar 12, 09:57
gold the next big bust

The gold bust is coming. How do we know? Because all of the leading and coinciding economic indicators are up. While the trailing economic indicators are now following suit. It would be insane to bet against the US economic engine at this time.


TEL
15 Mar 12, 19:07
What economic indictators are up ?

Depending on what numbers you are referencing all you are seeing are numbers going up on inflation. Unemployment isnt improving dont be fooled by U3, look at U6. Consumer confidence isnt rising. The housing market hasnt recovered. Real wages are declining - see FRED data. consumer debt is rising again which isnt a sign that people are spending but that they are using credit just to live.

The next big bust is the US Treasury Market


R.E.B
16 Mar 12, 16:23
Stalled US engine

There is no US economic engine, only money printing and creative accounting.


TEL
18 Mar 12, 18:02
@REB

I unfortunately have to agree. US GDP counts govt spending as GDP so we are counting borrowed and printed money as US GDP. The strong economic driver is Ben Bernanke's willingness to print money. People are too easily fooled by rising numbers such as the DOW. Its not rising value , its rising inflation, its excess liquidity, it is dollar devaluation.


Post Comment

Only logged in users are allowed to post comments. Register/ Log in