The Stock Market Dueling Forces of 2012
Stock-Markets / Stock Markets 2012 Jan 08, 2012 - 08:59 AM GMTBy: Clif_Droke
 The cyclical bull market recovery which began in March 2009 was powerful in its first year, moderately strong in 2010 and visibly weakened by the end of 2011. Thus we have the pattern of a recovery which is losing internal force with each passing year. The start of a New Year heralds some interesting possibilities for the coming 12 months, which we'll discuss in this commentary.
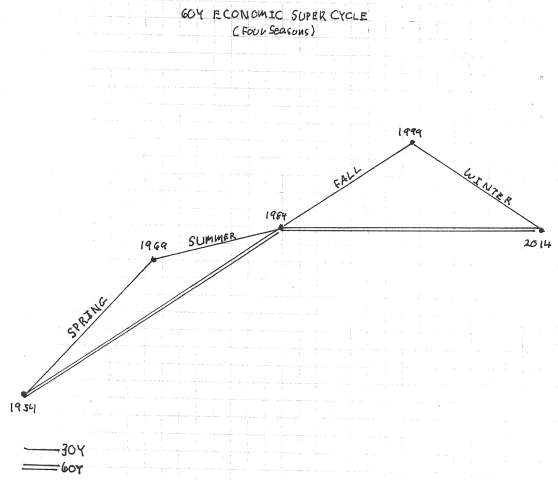
The Kress cycle configuration for 2012 suggests that the coming year will offer plenty of opportunities for both the bulls and the bears to profit before the final crashing phase of the 60-year Kress cycle begins in 2013 and catastrophic deflationary forces overwhelm the financial market.
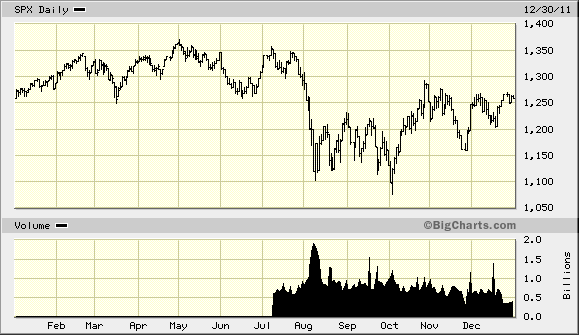
The year 2011 had some interesting dynamics which made for an essentially lateral trading range in the major indices. The 6-year cycle was up for much of the year which provided an underlying upward bias in the first four months of 2011. The price peak for 2011 was foreshortened by the peak in a major weekly cycle in late April, after which time the combined force of the declining weekly cycles and the sustained downward trend of NYSE internal momentum created a negative drag on stocks. This left the market weak and vulnerable to selling pressure until finally the August S&P downgrade of America's debt rating catalyzed a major sell-off.

The debt crisis in Europe added to investors' fears and provided additional fuel to the internal selling pressure stocks dealt with through much of last year. By October, the market was sufficiently oversold to allow for a recoil rally. An assurance of monetary liquidity by the world's biggest central banks in the fourth quarter of 2011 was enough to push the market off its early October low and keep it buoyed until year-end. The stock market as measured by the S&P 500 Index ended the year 2011 perfectly flat, neither adding to nor erasing its 2009-2010 recovery gains. The SPX closed the year at 1,257 - exactly 0.04 points under where it started the year.
That the stock market was basically range-bound for 2011 isn't surprising given the longer-term Kress cycle configuration we've been discussing. After the last of the important long-term weekly cycles, namely the 6-year cycle, peaked in 2011 the only yearly cycle in its ascending phase is the 4-year cycle. The rest of the long-term yearly cycles which comprise the 120-year Mega Cycle - the 6-year, 8-year, 10-year, 12-year, 20-year, 24-year, 30-year 40-year and 60-year cycles - are "hard down" until they all bottom simultaneously in October 2014.

The fact that these long-term yearly cycles are all down in the next (roughly) three years doesn't necessarily preclude one last decent year for stocks in 2012, however. The problem will be in getting there. The road to the second half of 2012, when the weekly cyclical influences will be most benign, will be preceded by a potentially bumpy ride in the first five months of 2012, with the worst of the volatility anticipated to begin in March.
Year 2012 in many ways could resemble 2011 in terms of the dueling forces between buyers and sellers which saw a sharp sell-off following the 6-year cycle peak, followed by a recovery in the final months of the year. Assuming the European credit crisis is fairly contained by June, when the weekly Kress cycles are scheduled to turn up on an interim basis, the second half of 2012 could very well be the final cyclical bull market before the final crashing phase of the yearly cycles comprising the 120-year cycle begins in early 2013.
Concerning the 120-year cycle, Samuel J. Kress writes in his latest SineScope missive:
"The first 120-year Mega Cycle began in the mid 1770s after a prolonged depressed economy and the Revolutionary War which transformed American from an occupied territory to an independent country as we know the U.S.A. today. The first 120-year cycle ended in the mid 1890s after the first major depression in the U.S. and the Spanish American War. This began the second 120-year cycle which transformed the U.S. from an agricultural to a manufacturing based economy and which is referred to as the Industrial Revolution. The second 120-year is scheduled to bottom in later 2014 to begin the third (everything comes in threes). If history, an evolving cycle, continues to repeat itself, the potential for the third major depression and a WWIII equivalent exists and the U.S. could experience another transformation and our life style as we know it today."
Kress goes on to observe that the three elements which govern our lifestyles - political, economic and social - will come into play as the current 120-year cycle bottoms. "The third [120-year bottom] scheduled for later 2014 (‘everything comes in threes') should be a social revolution," writes Kress. "Could this be the demise of capitalism as we know it today? The 120-year Mega Cycle could also be referred to as the Revolution Cyclce, and the 2014 date SineScope refers to as the Revolutionary low."
The road to 2014 has been a winding one and the severe deflation it is anticipated to bring beginning next year has been long in coming. Investors who are prepared for the deflationary winter it will bring should be able not only to survive but to pick up the bargains of a lifetime. Until we get to 2014 we have one more tortuous year of cross-currents to go through, however. Navigating 2012 will be challenging but not without its own rewards for the patient investor. The important thing to remember in the year ahead is to not allow your mind to be wedded to a particular market stances, whether bullish or bearish. Instead investors should stay flexible and follow the path of least resistance as dictated by the indicators.
Cycles: Over the years I've been asked by many readers what I consider to be the best books on stock market cycles that I can recommend. While there are many excellent works out there on the subject of technical and fundamental analysis, chart reading, etc., precious few have addressed the subject of market cycles. Of the relatively few books on cycles that are available, most don't even merit mentioning. I've read only one book in the genre that I can recommend - The K Wave by David Knox Barker - but even that one doesn't deal directly with stock market cycles but instead with the economic long wave. I'm pleased to announce, however, that after nearly 10 years of research and one year of writing, I've completed a book on the subject that I believe will meet the critical demands of most cycle students. It's entitled, The Stock Market Cycles, and is available for sale at: http://clifdroke.com/books/Stock_Market.html
By Clif Droke
www.clifdroke.com
Clif Droke is the editor of the daily Gold & Silver Stock Report. Published daily since 2002, the report provides forecasts and analysis of the leading gold, silver, uranium and energy stocks from a short-term technical standpoint. He is also the author of numerous books, including 'How to Read Chart Patterns for Greater Profits.' For more information visit www.clifdroke.com
© 2005-2022 http://www.MarketOracle.co.uk - The Market Oracle is a FREE Daily Financial Markets Analysis & Forecasting online publication.


