


Gold Buy Signal Whenever Trading Below 200 Day Moving Average
Commodities / Gold and Silver 2012 Jan 06, 2012 - 07:06 AM GMTBy: Peter_Degraaf

 During the 12 year history of this bull market in gold, only about 5% of the time did we see gold trading below its 200DMA, and each time it turned out to be a prime buying opportunity. (Charts courtesy Stockcharts.com unless indicated).
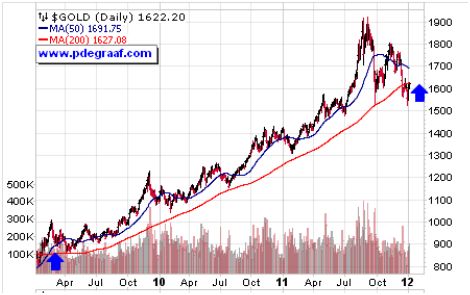
Featured is the daily gold chart. The last time gold traded below its 200DMA was during the autumn of 2008. As soon as the price climbed back above the 200DMA, it rose from $900 to $1,900. The fundamentals for gold are bullish enough for a repeat performance. Just make sure you are buying gold and not a ‘paper or digital substitute’ for gold.
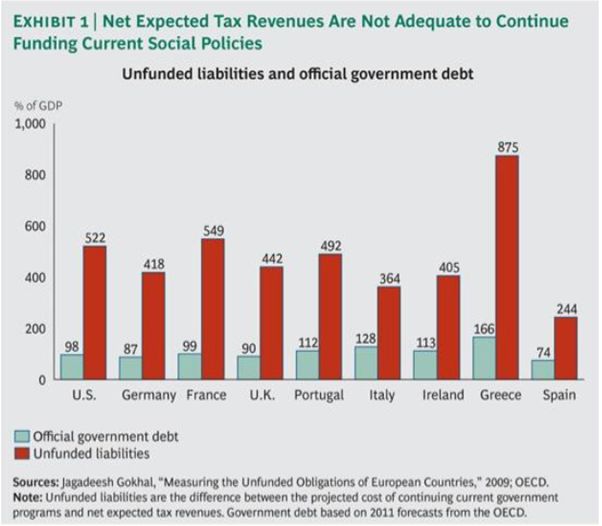
This chart courtesy Jagadeesh Gokhal, shows the fundamentals for gold quite clearly. Since tax revenues are inadequate to cover these liabilities, the central banks do what they’ve always done – they’ll print!
“In the distance, I see a frightful storm brewing in the form of un-tethered government debt. I choose the words –“frightful storm’ – deliberately to avoid hyperbole. Unless we take steps to deal with it, the long-term fiscal situation of the federal government will be unimaginably more devastating to our economic prosperity than the subprime debacle and the recent debauching of credit markets that we are working right now so hard to correct.” (Richard W. Fisher, President and CEO of the Federal Reserve Bank of Dallas Texas).
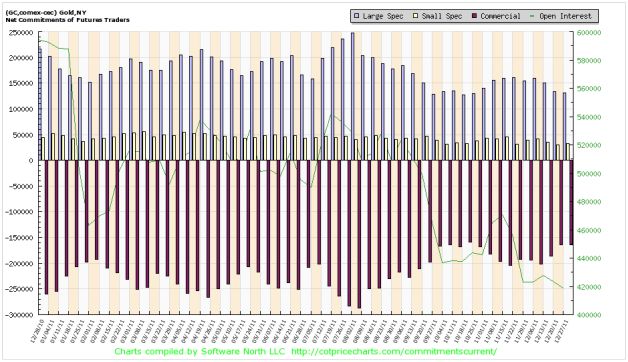
This chart courtesy Cotpricecharts.com shows the number of ‘net short’ gold positions (purple bars), closed at 165,000 last week. The current number is lower still, since gold fell on Wednesday and Thursday following this report. All in all this is a bullish chart for gold bulls, as historically when commercial traders are reluctant to find themselves ‘net short’, it is because they expect higher gold prices are ahead.
“Why then, is gold the unmentionable, four letter word of economics? ... The answer is threefold: A misunderstanding of the role of money; a misreading of history; and finally, visceral revulsion to the notion that a metal can do a better job of guiding monetary policy than a gaggle of finance ministers, central bankers and well-degreed economists." Malcolm Forbes.
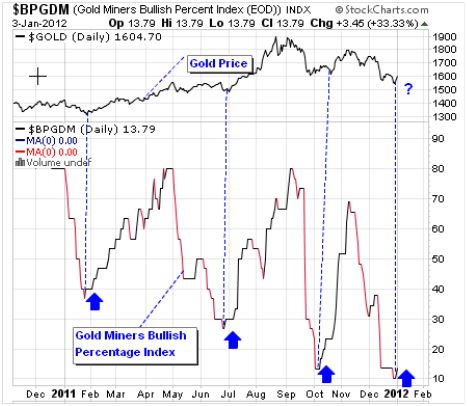
Featured is the Gold Miners Bullish Percentage Index from the Gold Miners Index ($GDM at Stockcharts). Virtually every time this index rises from below 30% you can count on a rise in the price of gold (see top of chart) that lasts a month or longer.
”Over the course of 600 years, five dynasties in China had implemented paper money and all five had made frequent use of the printing press in an attempt to solve problems. Economic catastrophe and political chaos inevitably followed. Time and time again officials looked to paper money for instant liquidity and the immediate transfer of wealth. But its ostensible virtues could not withstand its tragic legacy; those who held it as a store of value found that in time all they held were worthless pieces of paper.” (Ralph T. Foster, Author of Fiat Paper Money – the History and Evolution of our Currency – P 29).
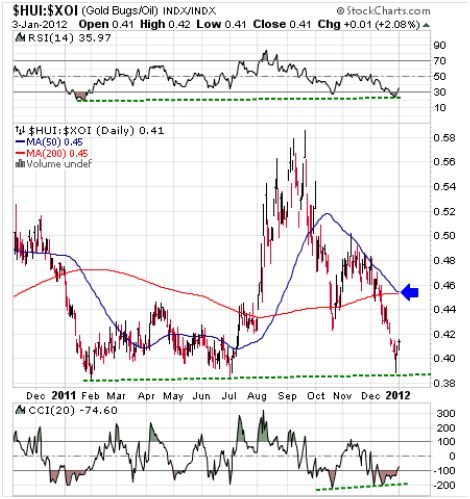
Featured is the index that compares gold producers to oil producers. Since October oil producers have outperformed gold producers. On Thursday Dec 29th the index produced a powerful ‘upside reversal’. Coming off previous support, technically the expectation is that gold producers will outperform oil stocks at least until the index reaches the blue arrow, and possibly beyond that point. The likely scenario is that both the HUI and the XOI will both rise, while the HUI rises faster.
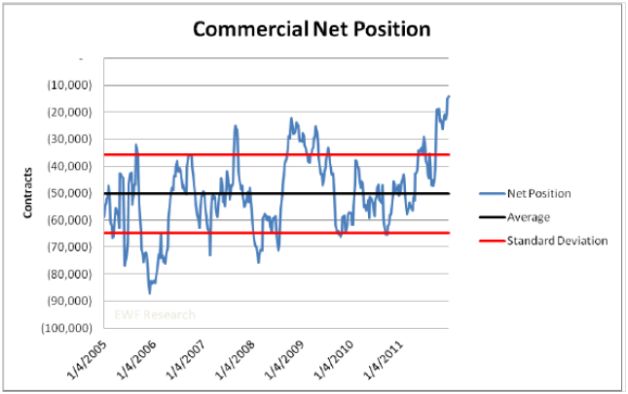
This chart courtesy Ewfreshresearch.com shows the latest ‘net short’ position in silver contracts to be the lowest since at least 2004. As we indicated in the ‘Weekend Report’ – “This is a very bullish chart for silver bulls.” We added to our silver stash this past week and hope you did the same.
"Gold is the money of kings; silver is the money of gentlemen;
barter is the money of peasants; but debt is the money of slaves."
(Norm Franz from his book: “Money, and Wealth in the New Millennium).”
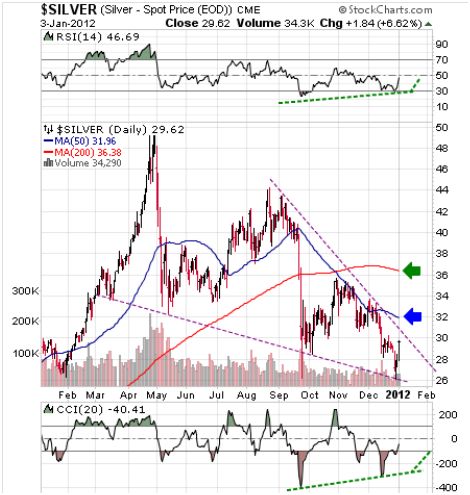
Featured is the daily silver chart. Price is carving out a bullish ‘descending wedge’ pattern. A breakout at the blue arrow sets up a target at the green arrow and a breakout at the green arrow turns the trend bullish again. The supporting indicators are positive (green lines).
Summary: Shame on those analysts who advise their subscribers to short gold and silver during a bull market and then charge for their ‘advice’. You can do that during a bear market, but not to a market that has produced a positive year end gains for the past 11 Years! Last day of the year gold prices: 2000 = 274.00; 2001 = 279.00; 2002 = 348.00; 2003 = 416.00; 2004 = 439.00; 2005 = 519.00; 2006 = 638.00; 2007 = 838.00; 2008 = 889.00; 2009 = 1097.00; 2010 = 1420.00; 2011 = 1566.00. Remember - “A trend in motion will remain in motion until it is stopped.”
Happy trading!
By Peter Degraaf
Peter Degraaf is an on-line stock trader with over 50 years of investing experience. He issues a weekend report on the markets for his many subscribers. For a sample issue send him an E-mail at itiswell@cogeco.net , or visit his website at www.pdegraaf.com where you will find many long-term charts, as well as an interesting collection of Worthwhile Quotes that make for fascinating reading.
© 2011 Copyright Peter Degraaf - All Rights Reserved
DISCLAIMER: Please do your own due diligence. I am NOT responsible for your trading decisions.
Peter Degraaf Archive |
© 2005-2022 http://www.MarketOracle.co.uk - The Market Oracle is a FREE Daily Financial Markets Analysis & Forecasting online publication.