


DOW hits historical Primary II B wave rally retracement range
Stock-Markets / Stocks Bear Market Jan 05, 2012 - 09:49 AM GMTBy: Tony_Caldaro

On October 22nd we posted this analysis of Major B waves, during Primary II, once the 61.8% retracement level was exceeded: http://caldaro.wordpress.com/2011/10/22/weekend-update-315/. It is at the beginning of the report.
As we continued our analysis, covering 1932-present, we reviewed all Primary waves for the entire period. What we found is quite interesting. Every rising Primary wave I or III, lasting from 5 months to 18 years in the study, was followed by a declining Primary wave II or IV of 1 year to 6 years. The shortest declining Primary wave, (July33-July34), followed the shorter rising Primary wave (Feb33-July33). Since our current Primary wave I lasted 26 months, we’re looking at a Primary wave II of at least 12 months. There’s more. No less than 80% of the time, the Primary wave bull market high was retested, (within -3.5% to +1%), at some point during the B wave portion of the declining Primary wave.
This would suggest the current B wave rally could rise to within 3.5% (SPX 1323) of the SPX 1371 bull market high, or even surpass it by 1% (SPX 1385). Then the C wave of the bear market would take over, returning the market to the A wave low or lower. Most of the time, 60%, the final bear market wave structure is a flat. As a result of this study we have added two additional retracement ratios to the SPX daily chart. It appears, however, should this B wave exceed the 61.8% retracement level at SPX 1258 by 1% or 2%, the market is likely going to make a run at the bull market high. There is one caveat. Even though this study covers nearly 80 years of market data the actual Primary wave sample was small, only twelve waves. In summary, our recent 26 month (Mar09-May11) Primary wave I bull market could be followed by a Primary wave II bear market lasting 1 to 6 years. Since bear markets are ABC wave structures, and the A wave ended in five months at SPX 1075, the current B wave could rally all the way back to the bull market high before the C wave takes over, and ends this bear market. This pattern can still fit within our scenario of the bear market ending in the spring 2012. It all depends on how long this B wave lasts.
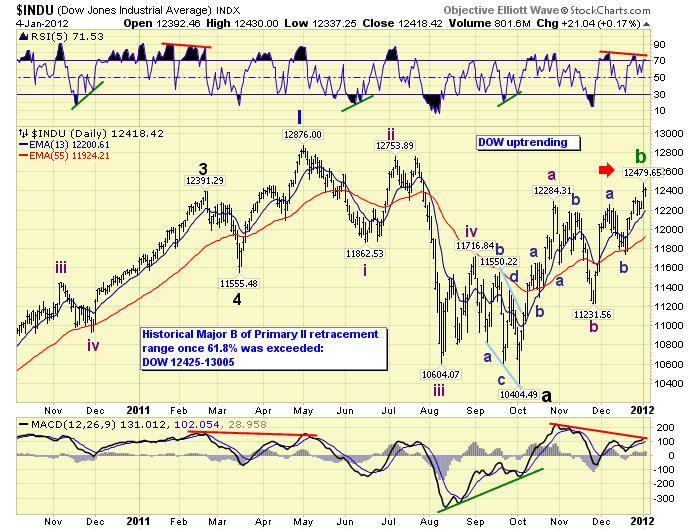
Unfortunately, thinking the SPX would follow the DOW, which it has not, I posted the B wave price levels using the SPX. But the entire analysis was done on the bellwether DOW. The 61.8% retracement level for the DOW was 11,932, and the 1%-2% range above this level was DOW 12,170. This cleared just before the October uptrend high at DOW 12,284. If we now plug in the historical Major B wave numbers for the DOW, (-3.5% to +1.0%) we have this range: DOW 12,425-13,005. The DOW entered this range on tuesday. The DOW has now reached the minimum level necessary to fit within all historical B wave rallies during a Primary wave II bear market.
CHARTS: http://stockcharts.com/...
http://caldaroew.spaces.live.com
After about 40 years of investing in the markets one learns that the markets are constantly changing, not only in price, but in what drives the markets. In the 1960s, the Nifty Fifty were the leaders of the stock market. In the 1970s, stock selection using Technical Analysis was important, as the market stayed with a trading range for the entire decade. In the 1980s, the market finally broke out of it doldrums, as the DOW broke through 1100 in 1982, and launched the greatest bull market on record.
Sharing is an important aspect of a life. Over 100 people have joined our group, from all walks of life, covering twenty three countries across the globe. It's been the most fun I have ever had in the market. Sharing uncommon knowledge, with investors. In hope of aiding them in finding their financial independence.
Copyright © 2011 Tony Caldaro - All Rights Reserved Disclaimer: The above is a matter of opinion provided for general information purposes only and is not intended as investment advice. Information and analysis above are derived from sources and utilising methods believed to be reliable, but we cannot accept responsibility for any losses you may incur as a result of this analysis. Individuals should consult with their personal financial advisors.
© 2005-2022 http://www.MarketOracle.co.uk - The Market Oracle is a FREE Daily Financial Markets Analysis & Forecasting online publication.