Silver Eagle & Maple Leaf Sales Up As Supply Slips
Commodities / Gold and Silver 2012 Jan 05, 2012 - 03:25 AM GMTBy: Steve_St_Angelo
 For the first time in history, Silver Eagle & Maple Leaf sales will surpass domestic silver production in the U.S. and Canada in 2011
The demand for American Silver Eagles and Canadian Maple Leaf coins has increased tremendously over the past several years. 2011 will be the first year in which official coin sales will surpass domestic silver production in both countries.
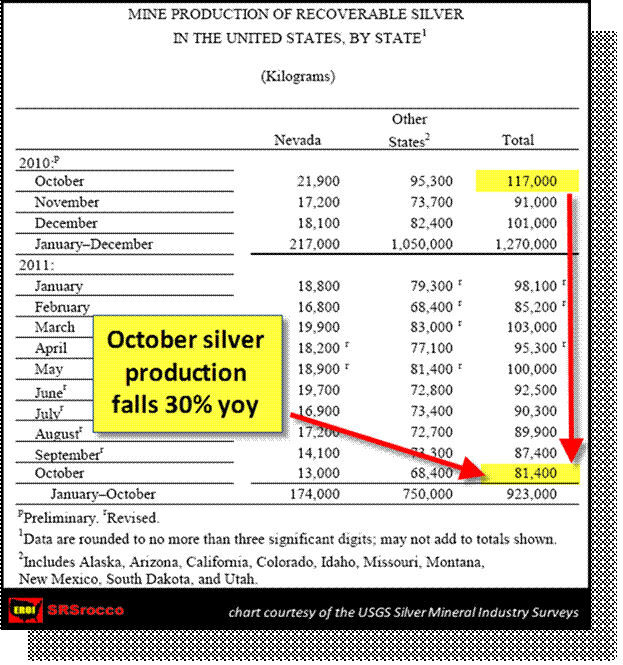
Even though each country has seen declines in their domestic silver production over the past decade, U.S. silver production declined a whopping 30% yoy (year over year) in October. According to the USGS in their most recent Silver Mineral Industry Survey, silver production fell to 81,400 kilograms in October— compared to 117,000 kilograms the same time last year.

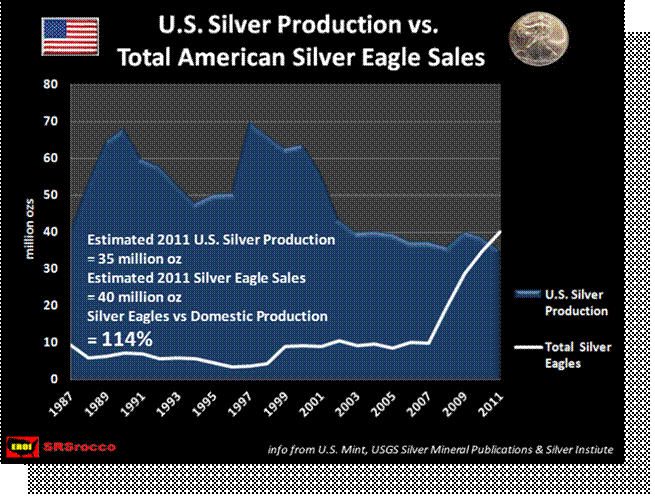
As of October this year, the United States has produced 923,000 kilograms or 923 metric tonnes of silver. This number will change as revisions are made, but currently U.S. silver production is down 15% compared to the first ten months of 2010. At this rate, the U.S. will produce an estimated 35 million ounces of silver this year. This is significant, as production will yield less than the approximate 40 million ounces of American Silver Eagle sales for 2011.
American Silver Eagle Sales Overtake Total U.S. Silver Production in 2011

Here we can see that U.S. silver production has declined 50% since its high of 70 million ounces in 1997. In 1997 American Silver Eagle sales were 3.6 million, which accounted for only 5% of domestic silver production. Contrasted to today, Silver Eagle sales are estimated to reach 40 million while domestic mine supply will decline to 35 million ounces in 2011. Thus, American Silver Eagle sales will be 114% of the total U.S. silver supply in 2011… what a difference in 14 years. This trend is also taking place in the country’s northern neighbor.
Canadian Maple Leaf Sales Outperform Silver Eagles in Percentage Growth
Canadian silver production has declined 57% from its recent high in 2002 at 44.1 million oz to an estimated 18.6 million oz this year. According to the Royal Canadian Mint’s 2003 Annual Report (and including figures from previous years), there were only 576,196 Silver Maple Leaf coins sold in 2002— making up about 1.3% of the total Canadian domestic silver production.
In 2011, this figure is estimated to reach approximately 22.5 million Silver Maple Leaf (SML) sales or almost 30% higher than its previous year’s total of 17.9 million. In comparison, 2011 American Silver Eagle sales are estimated to increase only five million sales over last year’s figures— or a 15% increase.
In the graph below we can see just how apparent this change of domestic silver supply vs. SML demand has become in the past several years:

The figure of 22.5 million SMLs for 2011 was estimated from the data obtained from the Royal Canadian Mint’s Third Quarter Report Fiscal 2011:
Sales of Silver Maple Leaf (SML) coins jumped to 6.1 million ounces during the quarter from 4.5 million ounces in the same period in 2010….During the 39 weeks to October 1, 2011, sales of SML coins increased by 56.1% to 17.8 million ounces.
If we consider that American Silver Eagle sales have declined in November, it would be appropriate to conclude that Silver Maple Leaf sales did as well. Assuming that fourth quarter SML sales would be approximately five million (as expressed in current trends) it would give us a figure of 22.8 million oz in 2011… rounded down to 22.5 mil oz to be conservative.
If these figures are correct and the Royal Canadian Mint does sell 22.5 million Silver Maple Leaf coins in 2011, it will be at a rate of 121% of their domestic silver production. 2011 will be the first year in which both the U.S. and Canada will sell more Silver Eagles & Maples than what is available from their respective silver mining supplies.
Does the U.S. Mint Have to Use Domestic Silver Mine Supply for its Silver Eagle Production?
There has been a great deal of discussion on the internet on whether or not the U.S. Mint is by law forced to use domestic silver production for their minting of American Silver Eagles. I have spoken with Michael White at the Office of Public Affairs at the U.S. Mint concerning this issue. Mr. White provided me the link to Senate Bill S. 2954, passed into law in 2002, which allows the U.S. Mint to purchase silver on the open market to produce American Silver Eagles. Wikipedia has also documented this below:
Program extension, 2002
The authorizing legislation for the American Silver Eagle bullion program stipulated that the silver used to mint the coins be acquired from the Defense National Stockpile with the intent to deplete the stockpile's silver holdings slowly over several years. By 2002, it became apparent that the stockpile would be depleted and that further legislation would be required for the program to continue. On June 6, 2002, Senator Harry Reid (D-Nevada) introduced bill S. 2594, "Support of American Eagle Silver Bullion Program Act," "to authorize the Secretary of the Treasury to purchase silver on the open market when the silver stockpile is depleted." The bill was passed by the Senate on June 21 and by the House on June 27 and signed into law (Pub.L. 107-201, 116 Stat. 736) by President Bush on July 23, 2002.
http://en.wikipedia.org/wiki/American_Silver_Eagle
If it were true that domestic silver was required to mint these coins, the U.S. Mint would have only produced approximately 35 million oz of Silver Eagles in 2011— instead of the supposed 40 million currently estimated. This is also true for the Royal Canadian Mint as it is now producing more Silver Maples than it can supply through Canada’s own domestic silver production.
Even though the U.S. and Canada produce more Silver Eagles and Maples than their domestic mine supplies, neither country has regarded this as a problem because they each have enough imported silver to meet all of their industrial and investment demands. However, this situation may change in the future as the global economy worsens and each country loses further trust in their respective fiat currencies.
The Myth Behind the So-called Silver Surplus
The investing public has been led to believe that the world is now producing a surplus of silver. This so-called surplus was provided by information put forth by GFMS. According to GFMS and its World Silver Surveys, there has been an annual global deficit of silver since 2003. In 2004 the world hit its first small surplus and has continued to grow. In 2010, the surplus was 175.4 million ounces.
To get its annual supply-deficit figure, GFMS uses a certain equation:
(Mine Production + Silver Scrap) – (Fabrication - Coin & Medal) = Surplus- Deficit
If we plug in 2010’s figures this is the result:
(735.9 + 215) = 950.9 – (878.8 - 101.3) = 775.5 = +175.4
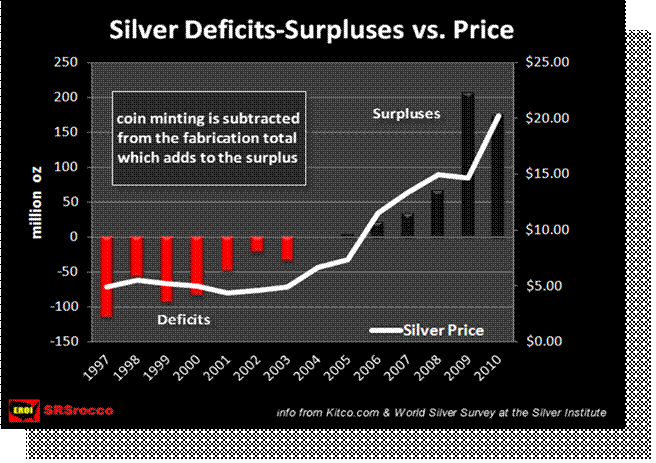
GFMS has decided that coin and medal demand should not be included in the Fabrication total but rather as a form of bullion supply. So the higher the coin and medal demand, the more it adds to the so-called silver surplus. The majority of this category of “Coin & Medal” consists of official government coins that are in high demand and are not of the type that would be sold for melt and recycled back into scrap supply. If we look at the chart below, we can see how GFMS has created this so-called silver surplus:

101.3 million of those 175.4 million oz of so-called surplus came from coin & medal demand in 2010. I find it interesting that GFMS has decided to treat the “Coin & Medal Category” (the majority of which are coins not readily available for melt and recycle) as supply rather than demand, but allow silver scrap from recycled fabrication to be used as a form of supply.
If we think about it for a minute, the whole idea of a surplus as expressed by GFMS is nothing more than an accounting gimmick. In 2010, there was 215 million oz of silver scrap added to the total supply. A large portion of this amount came from recycling silver from industrial scrap. Every year a certain amount of silver supply goes into industrial fabrication and of that amount, a percentage gets recycled into silver scrap which becomes supply in the following years.
Ask yourself this question… what would be considered more of future supply? Would it be comprised of official government coins that are in high demand and held for many years for their investment potential or a percentage of recycled silver from industrial fabrication? Even if investors sell Silver Eagles or Silver Maples back to a dealer, that dealer normally resells these coins back to other investors. These coins are the least likely to be melted and recycled.
Even if we were to go by the GFMS and their silver surplus vs. deficit figures, there is another interesting trend taking place. As coin and investment demand has risen, so has the price of silver. During the years attributed to a silver deficit, the price of silver remained relatively flat. As the so-called surplus has increased, so has the price of silver. Either way, silver investment is pushing the price of silver higher.
There have been several analysts who have stated that future silver surpluses will keep a lid on the price of silver. Here we can see that this is not the case at all. On the contrary, it has been due to investment demand that both the price of silver and the so-called surplus supply have grown.
The Coming Paradigm Shift in Silver
This is the subject of my next article which will be out shortly. The paper-backed situation in the world’s economies and financial system is grim. Silver should be priced at a level several times higher than it presently trading. Too many investors are becoming hypnotized by the technical analysis. However, technical analysis is a valuable tool in a FREE MARKET. Unfortunately, the markets and the silver charts are being manipulated while analysts who recreate these charts in their articles may not realize that they are actually helping the manipulators do their work by legitimizing its function on the internet’s financial websites.
Even though supply and demand factors contribute to the price of silver, it will be the shift in psychology that will propel the price of silver towards the heavens. This psychology has been slowing changing as the graphs above reveal an interesting trend taking place in the U.S. and Canada. In 2002 both countries produced 87.5 million oz of silver and sold 11 million Silver Eagles and Maple Leaf coins. These coins sales accounted for 12.6% of U.S. and Canadian silver production.
In 2011, just nine years later, the U.S. and Canada are estimated to mine only 53.6 million oz of silver combined, while their total Silver Eagle and Maple Leaf coin sales are to surpass approximately 62.5 million. Thus, their coin sales are 16% greater than their total domestic silver mine supplies.
Investors in increasing numbers over the years have been buying physical silver. While this number is growing, it is still a fraction of a fraction of the country’s population. Even though 40 million Silver Eagles were sold in 2011, this accounts for one coin for every eight Americans.
The Great Stampede in Silver is yet to come.
UPDATE: Since the completion of this article, the U.S. Mint has updated its 2011 American Silver Eagle sales. The grand total for 2011 turns out to be 39.8 million Silver Eagles sales while the month of January 2012 starts off with a whopping 3,197,000 sales on the first business day of the year. This is speculation on my part, but instead of updating the Silver Eagle figures during the last few days of 2011(as it normally does on a more regular basis), the U.S. Mint decided to dump all the remaining sales onto January 2012.
Steve St .Angelo Independent researcher residing in southwest Utah
Contact SRSrocco@gmail.com
© 2012 Copyright Steve St .Angelo - All Rights Reserved Disclaimer: The above is a matter of opinion provided for general information purposes only and is not intended as investment advice. Information and analysis above are derived from sources and utilising methods believed to be reliable, but we cannot accept responsibility for any losses you may incur as a result of this analysis. Individuals should consult with their personal financial advisors.
© 2005-2022 http://www.MarketOracle.co.uk - The Market Oracle is a FREE Daily Financial Markets Analysis & Forecasting online publication.


