


Stock Market Year End Notes, More Broadening Tops
Stock-Markets / Stock Markets 2011 Dec 27, 2011 - 12:13 AM GMT

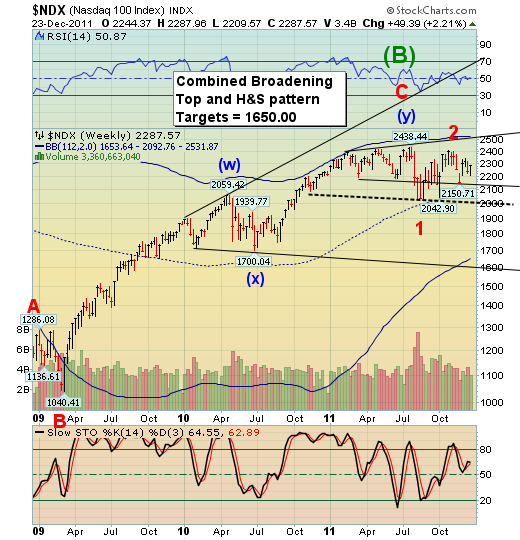
 While everyone is looking at the Dow in the SPX, virtually no one is paying attention to the NDX. The rally from August 9 to December 5 was very choppy and overlapping, with the best interpretation being a wave two. Since December 5 it has made an impulsive decline to 2950.71 and three wave correction. As of Friday it has stalled at mid-cycle resistance at 2287.57.
A decline from here to violate the lower trendline of the Broadening Top at 2150.71. Additionally a decline below 2042.90 also triggers a complex Head and Shoulders pattern. Although these patterns have targets in the mid-1600s.
This brings us to the next pattern, which may either be yet another Orthodox Broadening Top, or at minimum, another head and shoulders neckline. We can evaluate the behavior patterns of the NDX once we reach that level.
The patterning behavior in the SPX shows yet another broadening wedge formation terminating beneath the massive support resistance line. A broadening wedge is and ending formation, and may not go much higher than Friday's close. We'll know more tomorrow morning.
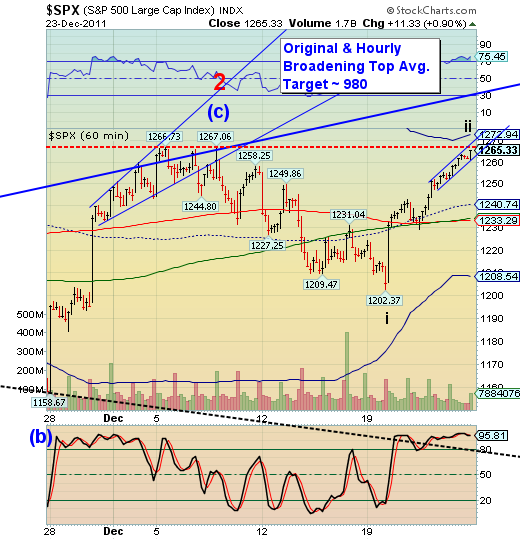
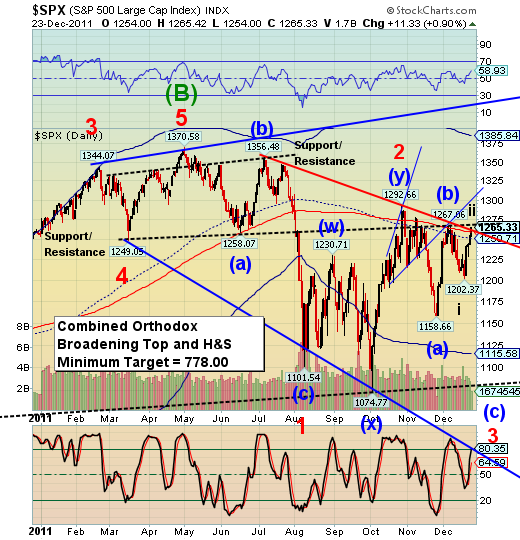
In the daily chart you can see the massive support resistance line starting at the March 16 low through the June 16 low and now the December 7 high. The line has a slight upslope, so if this rally chooses to go a few points higher, it may. However, the other indicators, including the VIX, already appear to be in reversal.
There is something new in this chart. It appears that the SPX is in a broadening diagonal pattern, which is very rare. Therefore, I have determined that the zigzag pattern from 1370.58 to 1101.54 is wave 1. What follows is an irregular wave 2 to 1292.66. It appears that we are now embarking on wave three which, by Elliott rules, should be at least 150% the size of wave one. It may be considerably larger. In a broadening diagonal, wave 5 will be the largest of all.
A decline below 1250.71, which is mid-cycle support/resistance, will give us the cyclical sell signal. The 200 day moving average is at 1259.19.
You can see the layering of the sell signals in the SPX in the weekly chart. The initial sell signal at 1265.00 has already had its target met at 1146.00.
We're now working on a second layer, which gives us the magnitude for wave three. Confirmation will come at the decline below 1074.77 for the head and shoulders pattern and below 1000.00 or the broadening top formation. Both get targets in the range of 700.00 to 800.00. Chances are very good that the green downtrend line will be intercepted below 800.00.
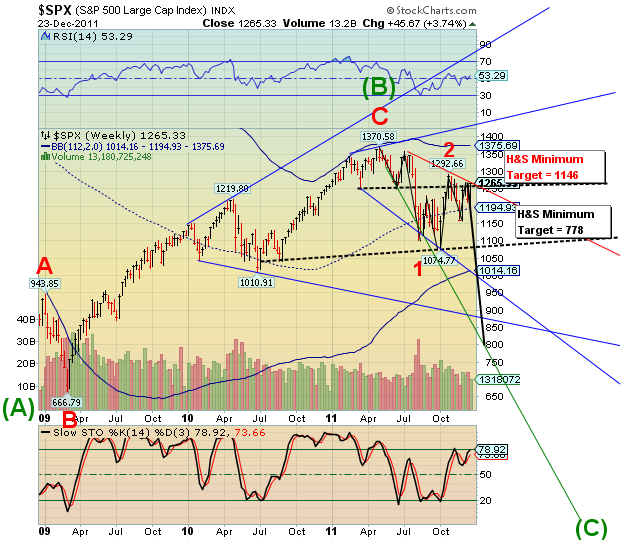
You can see the proportionality of the projected decline down to 800.00 or below to the rally from the July 2009 low at 869.32 or possibly even the March 2009 low at 666.79. A line drawn across from either of those lows to the projected low will give us a massive head and shoulders neckline and the projected targets for wave 5.
It took nine months to rally from the 869.32 low in July 2009 to the 1219.88 high in April 2010. My model suggests that the decline wiping out all those gains will only take three months, possibly less.
Happy Holidays!
Regards,
Tony
Our Investment Advisor Registration is on the Web
We are in the process of updating our website at www.thepracticalinvestor.com to have more information on our services. Log on and click on Advisor Registration to get more details.
If you are a client or wish to become one, please make an appointment to discuss our investment strategies by calling Connie or Tony at (517) 699-1554, ext 10 or 11. Or e-mail us at tpi@thepracticalinvestor.com .
Anthony M. Cherniawski, President and CIO http://www.thepracticalinvestor.com
As a State Registered Investment Advisor, The Practical Investor (TPI) manages private client investment portfolios using a proprietary investment strategy created by Chief Investment Officer Tony Cherniawski. Throughout 2000-01, when many investors felt the pain of double digit market losses, TPI successfully navigated the choppy investment waters, creating a profit for our private investment clients. With a focus on preserving assets and capitalizing on opportunities, TPI clients benefited greatly from the TPI strategies, allowing them to stay on track with their life goals
Disclaimer: The content in this article is written for educational and informational purposes only. There is no offer or recommendation to buy or sell any security and no information contained here should be interpreted or construed as investment advice. Do you own due diligence as the information in this article is the opinion of Anthony M. Cherniawski and subject to change without notice.
Anthony M. Cherniawski Archive |
© 2005-2022 http://www.MarketOracle.co.uk - The Market Oracle is a FREE Daily Financial Markets Analysis & Forecasting online publication.