U.S. the Payroll Tax 'Holiday' Extension a Festivus Miracle for GDP?
Economics / Taxes Dec 24, 2011 - 10:50 AM GMTBy: Paul_L_Kasriel
 In recent days many economists were preparing to lower their 2012 GDP forecasts in case Congress could not reach an agreement to extend the 2% reduction in the employee contribution to the payroll (FICA) tax. I kept getting questions on how much I was going to lower my forecast if the tax holiday were not extended. And I kept responding, 0.0%.
Why was I not going to change my forecast when the best and the brightest were estimating that a failure to extend the payroll tax holiday would knock anywhere from 50 to 100 basis points of 2012 GDP? For several reasons. For starters, the revenue reduction from the payroll tax holiday was supposed to be paid for by fee increases on Fannie/Freddie guaranteed mortgages and/or government spending cuts. So, while workers were getting a reprieve from payroll taxes, those who were receiving Fannie/Freddie guaranteed mortgages were paying more. Or some others would be getting less business from the federal government or lower wages from the federal government. So, in the case where the payroll tax holiday was to be paid for, its extension would simply redistribute income. A redistribution of income will please the winners and anger the losers, but it won't increase spendable funds in the aggregate and, therefore, it won't affect aggregate demand. If the payroll tax holiday were not extended, Fannie/Freddie fees presumably would not go up and/or federal government spending would be cut. Thus, there would not be any change in aggregate demand.
But let's assume that the extension of the payroll tax holiday was not going to be paid for with higher fees and/or government spending cuts but rather was going to be funded with increased government borrowing. Under these circumstances, if the payroll tax holiday were not extended, surely I would have cut my 2012 GDP forecast, right? Wrong. In this case if the payroll tax holiday is not extended, the federal government's borrowing requirement will be lower than it otherwise would be. This suggests that those who otherwise would have cut back on their current spending in order to purchase the additional bonds being sold by the government will now either spend these funds themselves or lend the funds to some other entity that wants to spend. So, the cut in spending by some because of their decreased after-tax income will be offset by the increased spending by others.
When analyzing the short-run macro effects of changes in fiscal policy, mainstream economists seldom ponder from where the funds come to pay for increased government spending or decreased tax revenues. The funds have to come from somewhere. Unless the funds are created "out of thin air," that is, unless the additional government bonds are acquired by the central bank and/or depository (monetary) financial institutions, all that is happening is that funds are being redistributed. Except in the case where the central bank and/or depository financial institutions acquire the additional government bonds, there is no net change in funds available for spending and, therefore, no net change in spending in the economy.
Another way of stating this is that a larger government deficit, that is, a greater amount of government dissaving, is offset by an increase in saving from the rest of the nonfinancial sector. Let's examine some actual data to see if there is any evidence for this hypothesis. The data we want to examine is net financial investment from the Fed's flow-of-funds data set. Net financial investment is defined as a specific sector's acquisition of financial assets, e.g., stocks, bonds, deposits, etc., minus that sector's increase in liabilities, e.g., borrowing. What we want to show algebraically is that net financial investment for a sector is equal to that sector's saving. So, let's do the algebra:
- Income + Borrowing = Spending on Nonfinancial Goods/Services/Assets + Acquisition of Financial Assets
- Income - Spending on Nonfinancial Goods/Services/Assets = Acquisition of Financial Assets - Borrowing
- Income - Spending on Nonfinancial Goods/Services/Assets = Saving
- Acquisition of Financial Assets - Borrowing = Net Financial Investment
- Thus, Net Financial Investment = Saving
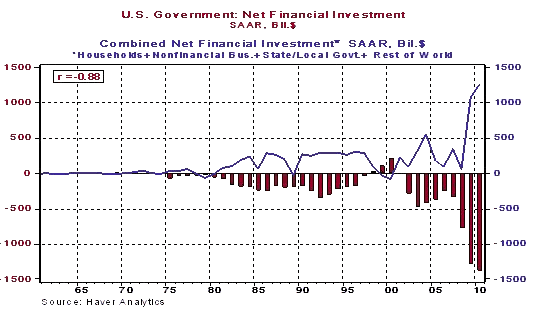
Again, our hypothesis is that the larger is the federal government's deficit, that is, the more negative is the federal government's net financial investment, the larger will be the combined positive net financial investment for the rest of the nonfinancial sectors. Lo and behold, this is what is shown in Chart 1. The correlation between the net financial investment for the federal government and combined net financial investment for the rest of the nonfinancial sectors is minus 0.88. This means that as the federal government's deficit increases, the rest of the nonfinancial sector increases its savings or decreases its current spending relative to its current income. Now, the correlation is not minus 1.00 and the dollar amount of negative/positive net financial investment for the federal government is not always equal to the dollar amount of combined positive/negative net financial investment for the rest of the nonfinancial sector. So, on some occasions, some of the deficit of the federal government is financed by the financial sector. When the federal government deficit is financed by the Fed and/or depository institutions, then funding for the federal government is created "out of thin air," and, thus, fiscal policy can have an impact on aggregate demand in the economy.
Chart 1

Is there a consistent relationship between changes in fiscal policy and changes in GDP? According to mainstream economists, you know, the ones who are quoted on cable news about how much GDP growth will be reduced if the payroll tax holiday is not extended, there should be a significant negative correlation between changes in the federal government's deficit and changes in GDP. That is, according to mainstream economic thinking, as federal deficit gets bigger, GDP growth ought to be higher. Now, I don't want to bias the case against these mainstream wizards. So, we need to look at the federal deficit adjusted for cyclical factors. After all, when the economy enters a recession, that is when nominal GDP growth slows, the federal deficit automatically will get bigger because tax revenues tend to grow slower and income-maintenance spending (e.g., expenditures for unemployment benefits, food stamps and Medicaid) tends to grow faster.
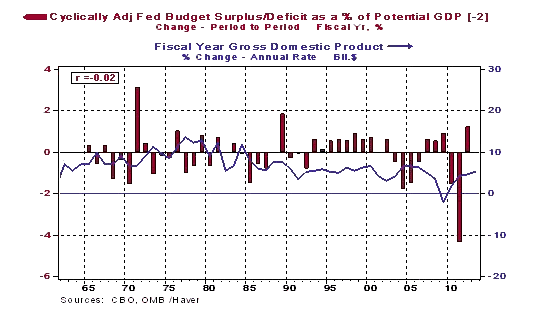
Fortunately, the Congressional Budget Office calculates something called the cyclically-adjusted federal deficit to account for these cyclical effects. Plotted in Chart 2 is the year-to-year change in the fiscal year nominal cyclically-adjusted federal deficit as a percent of potential nominal GDP versus the year-to-year percent change in fiscal year nominal GDP. According to the mainstream view, the larger the change in the deficit relative to potential GDP, the faster should nominal GDP grow. Thus, there should be a negative correlation between the two series, according to the mainstream view. In order to get a negative correlation, we need to have the change in the deficit relative to potential GDP lead growth in nominal GDP by two years. Otherwise, correlation coefficient is positive, which is at odds with the mainstream view. But even when we lead the deficit variable by two years, the absolute value of the correlation coefficient is a negligible 0.02. Hence, historically, there is no consistent relationship between changes in federal fiscal policy and changes in GDP. In other words, the extension of the payroll tax holiday will not turn out to be a Festivus miracle for the U.S. economy.

Paul Kasriel is the recipient of the 2006 Lawrence R. Klein Award for Blue Chip Forecasting Accuracy
By Paul L. Kasriel
The Northern Trust Company
Economic Research Department - Daily Global Commentary
Copyright © 2011 Paul Kasriel
Paul joined the economic research unit of The Northern Trust Company in 1986 as Vice President and Economist, being named Senior Vice President and Director of Economic Research in 2000. His economic and interest rate forecasts are used both internally and by clients. The accuracy of the Economic Research Department's forecasts has consistently been highly-ranked in the Blue Chip survey of about 50 forecasters over the years. To that point, Paul received the prestigious 2006 Lawrence R. Klein Award for having the most accurate economic forecast among the Blue Chip survey participants for the years 2002 through 2005.
The opinions expressed herein are those of the author and do not necessarily represent the views of The Northern Trust Company. The Northern Trust Company does not warrant the accuracy or completeness of information contained herein, such information is subject to change and is not intended to influence your investment decisions.
Paul L. Kasriel Archive |
© 2005-2022 http://www.MarketOracle.co.uk - The Market Oracle is a FREE Daily Financial Markets Analysis & Forecasting online publication.


