Stock Market Forecasts 2008 - FTSE, DAX and SPASX200
Stock-Markets / Elliott Wave Theory Dec 30, 2007 - 04:18 AM GMT

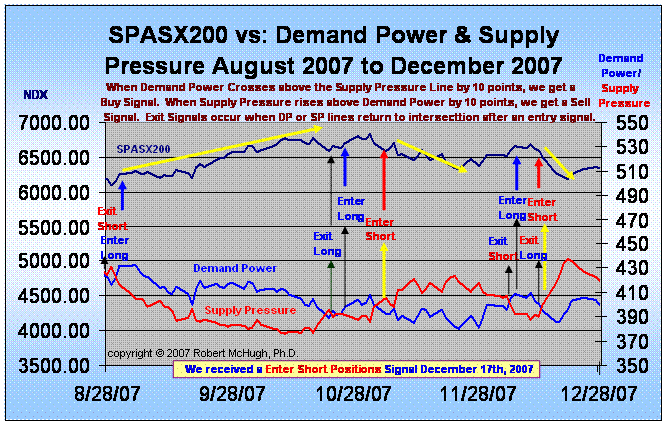
 The Australia SPASX 200 fell 11.00 points, or 0.17 percent, to 6,339.90 as of Friday, December 28th, 2007. Volume was 47 percent of its 10 day average. Downside volume led at 65 percent, with declining issues at 57 percent, with downside points at 51 percent in mixed trading. Demand Power fell 4 points to 400, while Supply Pressure fell 3 points to 420 , telling us neither side had strong conviction about the trend. Supply Pressure rose sharply above Demand Power Monday, December 17th, triggering an enter short positions signal, and remains there Friday.
Our key trend-finder indicators (other than DP/SP) remain on a “sell” signal December 21st. The Purchasing Power Indicator was flat at 90.26, remaining on a “sell” signal from December 14th. The 30 day Stochastic Fast fell to 33.15, above the Slow at 28.90, but not decisively above, remaining on a “sell” signal from December 14th . Prices dropped 6.0 percent since our key trendfinder indicators triggered new “sell” signals. As for international markets, it sure looks like they are headed into a huge bull market once the current corrective patterns complete. Both the FTSE and DAX look to be finishing Ascending Triangles, then a rally .
The 10 day average Advance/Decline Line Indicator remains on a “sell” signal from December 17th on Friday, breadth improving to negative –12.7, below the positive +10.0 needed for a new “buy.”
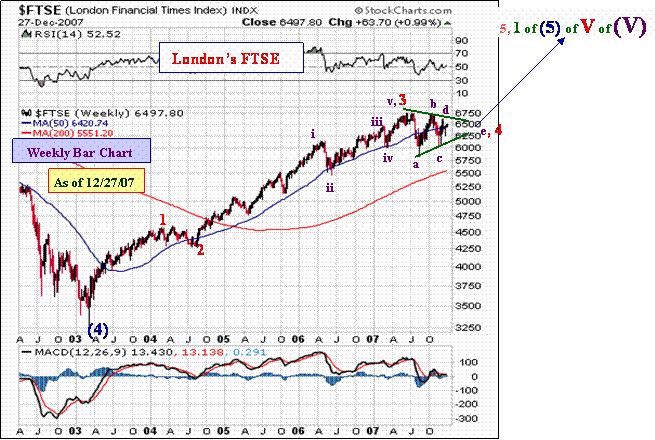
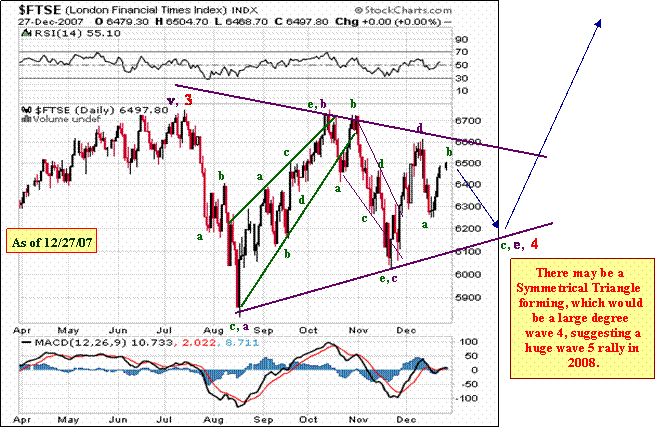
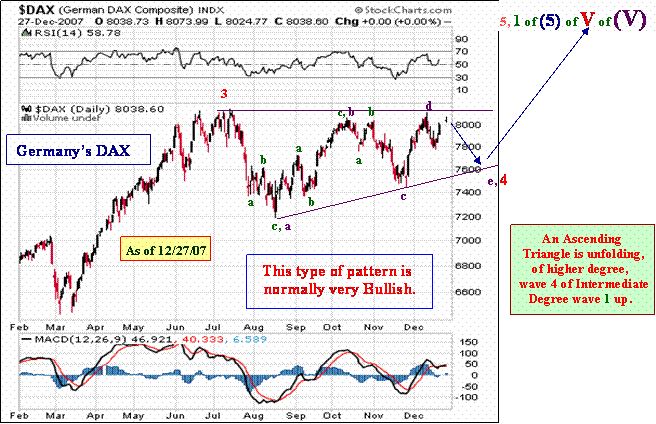
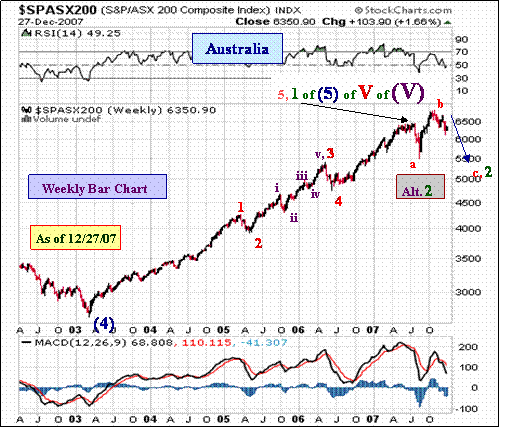
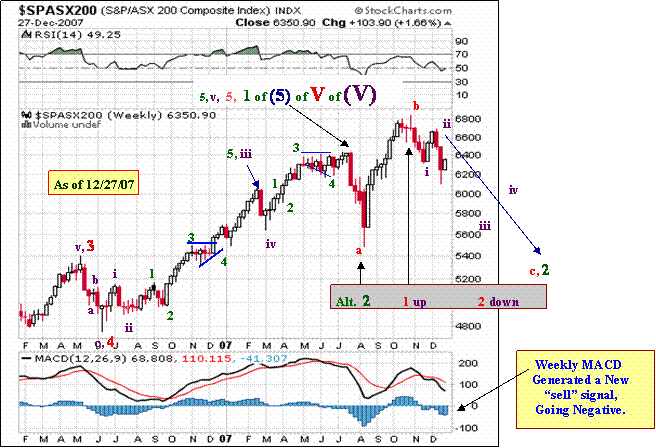
On a long-term basis , Intermediate degree wave 1 up of primary (5) up likely completed in July. Massive international liquidity infusions by central banks have floated markets higher, where inflation is being used as a tool by central banks to ward off declines in the stock market . A huge Bull market phase will continue after the current Intermediate wave 2 correction finishes. The alternate labeling is that Intermediate 2 down completed in August and a huge Bull market, Intermediate wave 3 up has started.
Short-term, waves a -down, b -up, and c -down of Minor degree wave a -down are complete. Wave b -up is now also complete. Wave i down and ii up of c down are complete, with iii down underway. Intermediate 2 -down is an a -down, b -up, c -down flat, so you can see we have further to go on the downside. Wave c -down will be a five wave decline, i- down, ii -up, iii -down, iv- up, v- down.
The blue histograms for the weekly MACD went negative, generating a sell signal, warning that wave c -down has started.
It is possible that the waves are all one degree smaller than we have charted, which if that is the case, means a protracted decline is underway, lasting into mid-2008. If our degree of waves charted is correct, then Intermediate wave 2 down could wrap in January 2008.
Alternately, wave 2 down completed in August, and we are inside a developing Intermediate wave 3 up.
For a FREE 30 Day Trial Subscription to McHugh's Daily and Weekend Newsletters, covering both international and U.S. Markets, simply go to www.technicalindicatorindex.com and click on the button at the upper right of the home page.
“Jesus said to them, “I am the bread of life; he who comes to Me
shall not hunger, and he who believes in Me shall never thirst.
For I have come down from heaven,
For this is the will of My Father, that everyone who beholds
the Son and believes in Him, may have eternal life;
and I Myself will raise him up on the last day.”
John 6: 35, 38, 40
by Robert McHugh, Ph.D.
technicalindicatorindex.com
If you would like a Free 30 day Trial Subscription , simply go to www.technicalindicatorindex.com , and click on the FREE Trial button at the upper right of the home page. A subscription gains you access to our buy/sell signals, our Market Analysis Newsletters, Traders Corner, our model Conservative Investment Portfolio, Guest Articles, and our Archives.
Robert McHugh Ph.D. is President and CEO of Main Line Investors, Inc., a registered investment advisor in the Commonwealth of Pennsylvania, and can be reached at www.technicalindicatorindex.com. The statements, opinions, buy and sell signals, and analyses presented in this newsletter are provided as a general information and education service only. Opinions, estimates, buy and sell signals, and probabilities expressed herein constitute the judgment of the author as of the date indicated and are subject to change without notice. Nothing contained in this newsletter is intended to be, nor shall it be construed as, investment advice, nor is it to be relied upon in making any investment or other decision. Prior to making any investment decision, you are advised to consult with your broker, investment advisor or other appropriate tax or financial professional to determine the suitability of any investment. Neither Main Line Investors, Inc. nor Robert D. McHugh, Jr., Ph.D. Editor shall be responsible or have any liability for investment decisions based upon, or the results obtained from, the information provided. Copyright 2007, Main Line Investors, Inc. All Rights Reserved.
Robert McHugh, Ph.D Archive |
© 2005-2022 http://www.MarketOracle.co.uk - The Market Oracle is a FREE Daily Financial Markets Analysis & Forecasting online publication.


