


Important Stock Market Support Levels at 1230.59 to 1227
Stock-Markets / Stock Markets 2011 Dec 13, 2011 - 11:47 AM GMTBy: Marty_Chenard

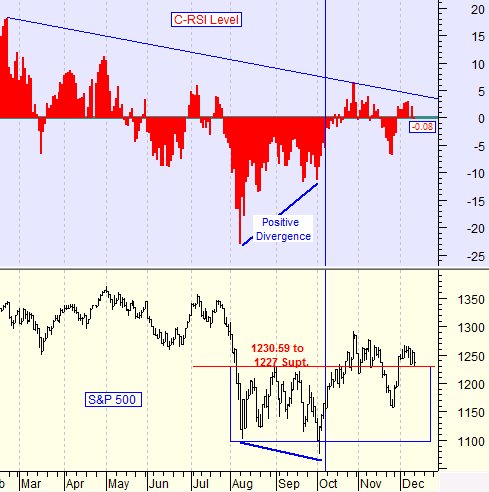
Today's graph shows the S&P 500's action for 2011. Our C-RSI indicator in red measures the strength of the underlying index.
I should say that it is measuring the strength of the market on this chart because the S&P 500 is regarded as the best index for depicting the condition of the economy. The reason Institutional Investors give for this, is that they say "the S&P 500 represents the best picture of what is happening to important Sectors in our economy".
So, let's discuss what today's chart is showing. First, the C-RSI strength is showing down movement from its peak this past February. Note the blue, down sloping line we drew, it is a resistance line showing that the S&P's strength has not been able to rise above it ... which is where you want it to be for another Bull leg up.
Yesterday's close came in at a (minus) -0.08 on our C-RSI which is essentially a Neutral reading because it was so close to zero, but it also means that this is a Danger condition for the upside.
When you get this kind of reading, it is good to look at the support level of the underlying instrument being analyzed. In this case, it is the S&P 500 and it is showing a support level range of 1230.59 to 1227. With the current weakness in strength, the 1230.59 to 1227 support levels become something investors should keep an eye on.
By Marty Chenard
http://www.stocktiming.com/
Please Note: We do not issue Buy or Sell timing recommendations on these Free daily update pages . I hope you understand, that in fairness, our Buy/Sell recommendations and advanced market Models are only available to our paid subscribers on a password required basis. Membership information
Marty Chenard is the Author and Teacher of two Seminar Courses on "Advanced Technical Analysis Investing", Mr. Chenard has been investing for over 30 years. In 2001 when the NASDAQ dropped 24.5%, his personal investment performance for the year was a gain of 57.428%. He is an Advanced Stock Market Technical Analyst that has developed his own proprietary analytical tools. As a result, he was out of the market two weeks before the 1987 Crash in the most recent Bear Market he faxed his Members in March 2000 telling them all to SELL. He is an advanced technical analyst and not an investment advisor, nor a securities broker.
Marty Chenard Archive |
© 2005-2022 http://www.MarketOracle.co.uk - The Market Oracle is a FREE Daily Financial Markets Analysis & Forecasting online publication.