Base Metals 2008 Trend Determined by LME Stock Piles - Copper, Zinc, Nickel, Lead and Aluminum
Commodities / Metals & Mining Dec 28, 2007 - 01:06 PM GMTBy: Zeal_LLC
 From their lows in the early 2000s, base metals prices have soared to achieve highs in the last couple years that many would have thought unheard of. Traders that were long in both the futures and the stocks of the mining companies that bring these metals to market have seen legendary gains.
This rapid appreciation of base metals prices has been undergirded by rock-solid fundamentals. Asia 's modernization and industrialization is commanding massive commodities inflows. And to support its insatiable appetite for base metals in particular, an economic imbalance has crept into these markets that has simply caught the world off guard. These industrial metals that go into the infrastructural and mechanical web of global growth have seen supply greatly lag fast-rising demand.
Well with the base metals shedding some of their amazing gains of recent , they have begun to fall off the radars of investors and speculators and are attracting a growing population of scoffers and naysayers. This across-the-board pullback does indeed have support from slightly-weakening interim fundamentals. But interestingly we are starting to see some capitulation.
Many folks, even various analysts and so-called industry experts, have thrown up their hands in surrender proclaiming the end of this commodities bull. People are getting tired of hearing about the global growth story and bullish sentiment is indeed waning on the commodities front.
This is just fine though and is in fact completely normal. Prices aren't the only things that flow and ebb in the markets. The emotions of greed and fear always follow this same pattern. In our uptrending secular commodities bull the short-term oscillations within this trend are typically driven by prevailing market psychology.
Two important things a successful trader in this commodities bull must understand are first the underlying drivers of the markets, the fundamentals, and then how to harness his emotions. While emotions can never truly be mastered but only be refined with practice and fortitude, fundamentals can be viewed objectively.
Now sometimes I feel like I am beating a dead horse, but the reality is the global growth story is still unfolding in its early stages. And China alone gives us plenty of reasons to stay bullish on commodities. Many experts believe it will surpass the US as the world's largest economy in the next 15 to 20 years. And I've even seen studies indicating that China 's fixed assets will continue to double every three or so years.
I can go on and on about long-term fundamentals, but my focus today is on the tactical nature of base metals' price actions. As traders we need to be keen on the machinations that influence this market. And just because assets trend up in a secular fashion it doesn't mean they aren't susceptible to pullbacks in order to rebalance prices and sentiment.
A couple months ago I analyzed the technicals of the five major base metals. It was apparent that most of these metals were reeling to establish support off their respective highs. But in the last couple months the base metals have continued to fall. And in large part it has been their interim measurable fundamentals that have driven them lower.
So the first place I go to gauge the health of the base metals sector is the London Metal Exchange (LME). The LME is the world's largest non-ferrous metals exchange and serves many important roles in the markets. Not only is it the most reliable source for daily base metals prices, but its various other functions are indispensable for commodities speculators.
Of the LME's many functions the most visible is its hosting of the futures and options markets. Aside from the speculative nature of futures and options, these instruments are essential in mitigating risk. They allow both consumers and producers to lock in prices, also known as hedging.
But the key function of the LME that I'll focus on is the physical storage of the metals that comprise its traded contracts. And the primary reason the LME houses stockpiles is to ensure price convergence. Every contract traded on the LME assumes physical delivery.
But since hedging and speculating rule trading on the LME and every other global commodities exchange, most contracts are sold or bought back prior to settlement. Only a small percentage of contracts actually result in delivery. And the metals that are stockpiled in the hundreds of warehouses strategically located around the world are what are drawn upon if indeed this happens.
Now this physical storage is not designed to supersede existing supply chains between producers and consumers. But when in fact contracts are actually delivered upon, it can be implied that consumers' needs are not being met via regular channels. Therefore the fluctuations of stockpile levels can paint a good picture of the prevailing global supply and demand balance. And these fluctuations ultimately serve to be a strong influence on the pricing of the base metals.
In this ongoing essay series I've been analyzing the correlation between movements in stockpile levels and prices. And in recent years for the most part there has been an incredible inverse correlation between the two. But this correlation hasn't always been as strong.
Up until recent years there have been ample metals stockpiles to absorb the occasional delivery of contracts. Many producers consistently delivered excess supply to the LME's warehouses. This created a huge cushion of above-ground supply and kept base metals prices low. Supply growth in most cases trumped demand growth.
Well after the turn of the century the Asian economies got a firm hold on their bootstraps. And their thirst for commodities became unquenchable. As base metals demand grew the suppliers were quickly overwhelmed. When needs couldn't be met through direct buying, LME stockpiles were the next logical place for consumers to go.
The then-lofty stockpile levels were able to absorb early demand growth without affecting prices too much. But when the pilfering of warehouses continued and it was apparent that demand wasn't going to subside tomorrow, prices reacted sharply.
And when LME stockpile levels were able to be measured in days of daily global consumption versus weeks or months, this sent an alarming message to commodities traders. Prices in some cases went parabolic as large speculative risk premiums were placed on those metals that saw stockpile levels continue to drop. “Base metals scarcity” would normally be considered an oxymoron, but this was actually becoming reality.
With stockpile levels so low, any build or draw was closely monitored and prices reacted in real-time. If stockpiles fell, prices would rise. And if stockpiles grew, a portion of the risk premium was shed and prices would retreat. This made stockpile fluctuations extremely valuable for traders to watch.
Since the LME provides daily stockpile and price data, even you and I can observe the behind-the-scenes actions of these highly volatile commodities. As mentioned this phenomenon has created an incredible inverse correlation for most of the base metals. And we can watch this unfold visually by plotting the data in charts.
Well a lot has happened since I last wrote about LME stockpiles in April. At that time the base metals were in fine shape. Copper was in the midst of another powerful upleg that had it charging toward its 2006 all-time high. Nickel and lead were still carving all-time highs within their amazingly strong uplegs. And zinc and aluminum were consolidating nicely off their previous highs.
All was well in base metals land. LME stockpiles were low, prices were high, and investors were bullish on these metals' futures. Today we see a stark contrast. Prices are down and folks are scared of base metals and the stocks of the companies that bring them to market. As you can probably guess, this is in large part the result of growing global stockpiles.
These growing global stockpiles are harboring fear that this is the end of the road for base metals. Is Asia done growing? Did the mining companies open a spigot that shot out an excess supply of metals? Is corn replacing metals for all industrial purposes? Absolutely not! As mentioned earlier the long-term fundamentals are still intact.
Knowing this I would like to again take a look at where we stand technically as measured by these LME stockpiles. First let's look at copper, the most influential base metal of this group. The last time we looked at copper it was on the high side of its recent upleg that petered out in early May 2007. And as you can see in this chart, copper has continued to exhibit a strong inverse correlation to the movements of its LME stockpile levels.
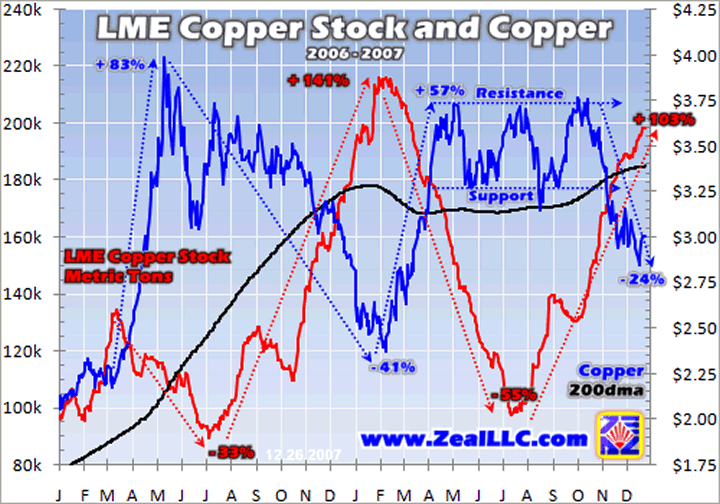
In May of 2006 copper reached its apex in parabolic fashion. Over the course of this powerful upleg copper stockpiles reached alarmingly-low levels. This caused speculators to launch the price of copper into an unsustainable northward trajectory. So once stockpile levels finally started to rise, copper was doomed for a healthy correction.
Surprisingly instead of crashing after the parabola, the price of copper consolidated downward off its top in orderly fashion. While still in the mid-$3.00 range copper ground downward slowly as stockpile levels began to rally higher. Then in October 2006 the increase in copper stockpiles accelerated causing copper to break its trend channel on the downside and eventually fall to its February 2007 low.
During this four-month span the inverse correlation was incredibly tight. There was a mathematical negative correlation of -0.949 with an r-square of 90%. So 90% of the daily behavior of copper from October 2006 to February 2007 could be explained by the inverse movement of its daily LME stockpile levels.
In the nine months following its all-time high the price of copper ended up shedding 41% as LME stockpile levels soared 141%. After this large build LME copper stockpiles sharply rounded the corner and commenced a sharp draw once again. This of course led to copper soaring higher in a powerful three-month upleg that saw copper rise 57% before encountering resistance.
Concurrent to copper's rise, LME copper stockpiles were cut in half and in July 2007 pierced the 100k metric ton level. This is the equivalent of less than three days worth of global daily copper consumption. But for those speculators hoping that this development would cause copper to surpass its all-time high achieved more than a year earlier, they were mistaken.
What happened after LME copper stockpiles hit their July 2007 low was in effect a V-bounce that in just the last five months has seen the stockpiles double. And this of course caused copper to break its seven-month trend channel to the downside.
Once again the inverse correlation is readily apparent. From copper's interim high in the beginning of October 2007 it has run a negative correlation to LME copper stockpiles of -0.962 with an r-square of 93%. And so far copper is down 24% in its two-month-and-counting slide.
Now I'm sure this is troubling for those folks new to the base metals game. But this all needs to be looked at in strategic context. It is important to understand where we came from. As recent as late 2003 copper was trading under $1.00. And from its low of $0.60 in late 2001, copper is still up over 400% today.
And even though on this chart it looks as though LME copper stockpiles are on the high side when they get into the 200k metric ton range, all we need to do is look a little farther back to realize that this is still historically low. Just in 2002 LME copper stockpiles were close to 1m metric tons!
So while copper investors have been conditioned to $3.00 as normal, this is still measurably high compared to just a couple years ago. Copper still has a lot of wiggle room before you really need to worry about a structural problem with its bull market.
Now the reason I mentioned earlier that most base metals were running tight inverse correlations with their LME stockpile levels is because not all of them are currently doing so. And zinc is one base metal that is exhibiting some peculiar behavior.
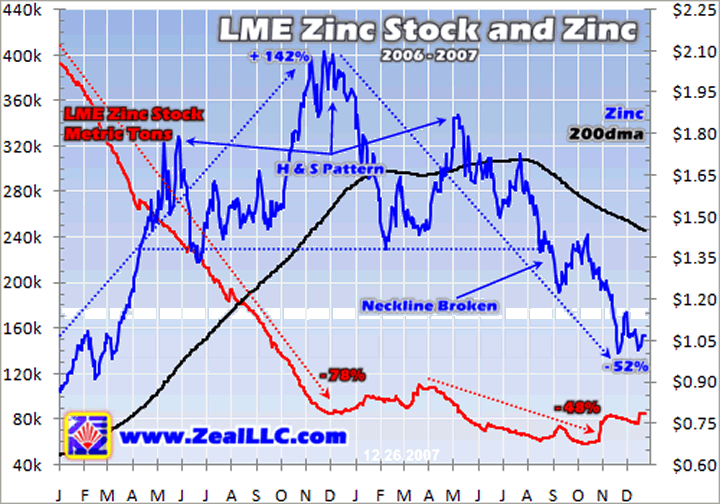
Zinc's major upleg lagged copper's a bit in that its initial large LME stockpile draw remained on a linear descent through the end of 2006. But this also led to zinc outperforming copper in the second half of 2006 as it didn't hit its apex until the end of November.
And 2006 was an incredible year for zinc. After rising 64% in 2005, it soared another 142% in 2006. This was of course on the heels of zinc stockpiles that were just obliterated, falling 78% on the year alone. The inverse correlation worked beautifully in 2006.
But 2007 has certainly been a different story. Looking at what the price of zinc has done in 2007 you would think LME stockpile levels were soaring. But this is hardly the case. Now when zinc stockpiles leveled in December 2006 it makes sense that some of the speculative risk premium built into its lofty price would be shed. And this is what we saw. It then also makes sense that when stockpile levels started to fall once again in April 2007 that zinc would rally.
But this rally only lasted for one month before zinc gave up its ghost and started falling to the levels we see today. This has been quite odd price behavior as there never really was a sizeable build in stockpile levels since the flattening one year ago. In fact, from April 2007 to the end of October 2007 LME zinc stockpiles fell another 48% to record lows! At only about 60k metric tons, the markets were faced with the equivalent of only two days of daily global consumption.
And these disturbingly-low stockpile levels don't seem to phase the zinc market one bit. I honestly cannot figure out why. From a technical perspective we do see a classic head-and-shoulders pattern in this chart. And this type of pattern is typically bearish, usually leading to a trend-reversal pattern. A technician would look at zinc's price chart and not be surprised to see it decisively break its neckline. But in my experience fundamentals often trump technical noise. Not so with zinc.
But like copper we need to look at zinc in a strategic context. Zinc is still 214% above its 2003 low of $0.34. As for LME zinc stockpile levels, as recent as 2004 they were nearly 800k metric tons! Still below 100k today, they are vastly lower than just a few short years ago. Ultimately I am long-term bullish on zinc, but I am a little worried about its near-term price if there is a big build in its stockpile levels. We'll have to wait and see.
Nickel is another of the base metals exhibiting wild swings in response to fluctuations in its above-ground stockpile levels. As you can see in this chart nickel has been quite volatile in the last couple years.
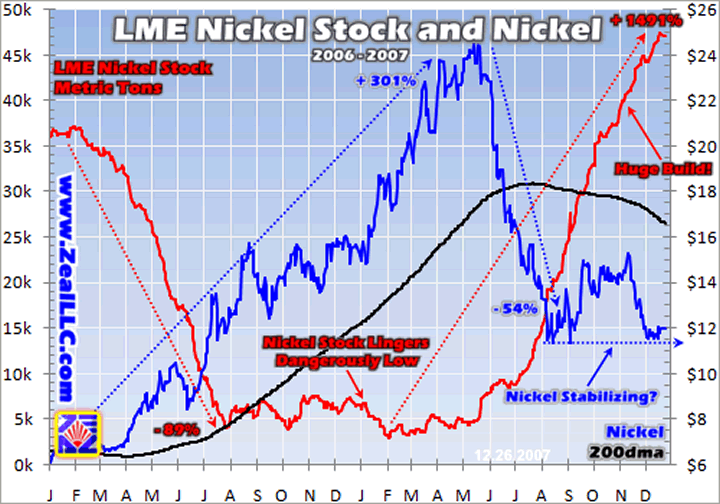
Lagging copper and zinc, nickel's massive upleg stayed hot all through 2006 before it reached its apex in May 2007. This incredible strength was in large part due to a plummeting LME nickel stockpile. In just six months, from February to July 2006, LME nickel stockpiles fell by 89%!
After the LME stockpiles' quick linear retreat to just 5k metric tons, they hovered at these dangerously-low levels for ten long months. During this time the markets placed a huge risk premium on the price of nickel pushing its price to an incredible $24.50. From the beginning of 2006 to May 2007, nickel rocketed over 300% higher!
As you can see the tides have since changed. As goes the LME nickel stockpile levels so goes nickel, to the inverse of course. Beginning in May 2007 nickel stockpiles decisively broke above the 5k metric ton level and commenced a parabolic ascent that has taken them over 1400% higher!
This massive build simply pounded nickel into a bloody pulp. In just three months nickel lost over half its value. But this metal has shown some resiliency. As LME nickel stockpiles continue their linear ascent higher, over the last five months nickel seems to have found some support around the $12.00 level.
And of course from a strategic perspective $12.00 nickel is still incredibly high. From its low of $2.00 in late 2001, nickel is still up a stellar 500%! Ultimately this most speculative of metals has a significantly smaller capital market compared to the other base metals. And we are likely to see extreme volatility with this metal going forward.
Lead's bull market was a late bloomer and finally came into its element in 2007. And its actions in recent years really display the powerful influence LME stockpile levels can have on the base metals.
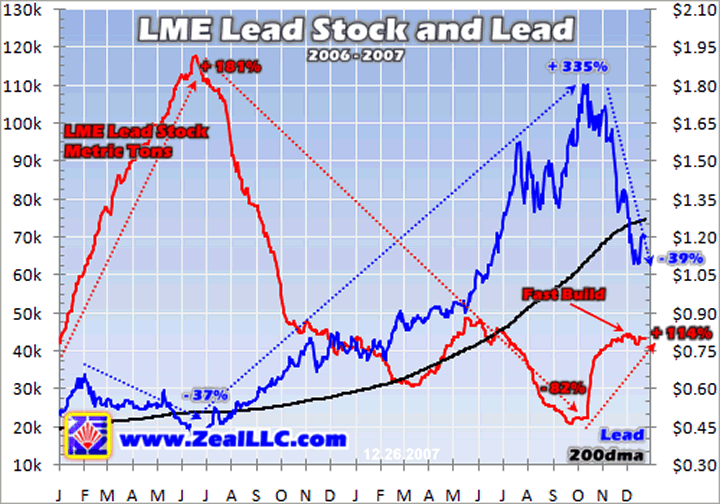
While the other base metals were picking up steam in 2005 and the first half of 2006, lead was in the doldrums. In the first half of 2006 LME lead stockpiles saw a hefty build of 181%. This of course did not bode well for the price of lead. During this time lead fell 37% before finally getting some reprieve.
In June 2006 lead stockpiles turned the corner and commenced a draw that saw 82% of the inventory disappear. And this draw ignited a powerful upleg that saw lead rocket 335% higher in this same 16-month span. This brought LME lead stockpiles down to only 20k metric tons, the equivalent of only about one day of daily global consumption.
Naturally these low levels attached a huge risk premium to the price of lead. So when stockpiles started to rise in October 2007, lead started to shed some of this premium and has fallen 39% in quick order. But this 40k metric ton LME stockpile is still less than a quarter of what it was in 2003. Lead supply is still on short order, and even at $1.00 lead is 415% higher than its 2003 low.
Aluminum is the least exciting of the base metals. And this is simply because of the size of its capital markets. Measured by volume, more aluminum is produced and consumed each year than all the other base metals combined. Therefore its volatility on both the stockpile and price fronts is not as erratic.
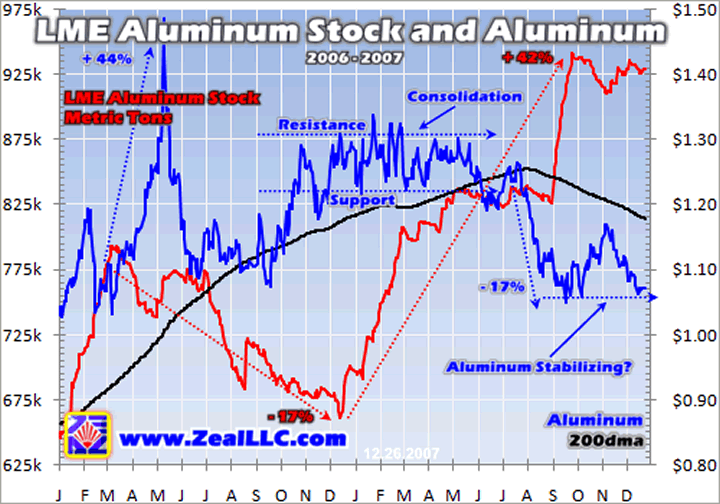
As recent as early 2004, LME aluminum stockpiles were over 1.4m metric tons. As the stockpiles depleted, aluminum climbed from its 2001 low of $0.60 to its May 2006 spike-high of nearly $1.50. But even with this decline in stockpiles, measured in terms of daily consumption these levels are nowhere near as low as the other base metals. This is why the advances and declines of aluminum's price in the last couple years are less extreme.
In the latter half of 2007 with most of the base metals exhibiting weakness, aluminum has followed suit. LME aluminum stockpiles initiated a build in the beginning of 2007, and in August aluminum's sideways consolidation finally broke to the downside. But even this downside loss was a modest 17% at worst and the price of aluminum seems to have found some short-term support over the last few months.
So as you can see, on balance the weakness in base metals prices in recent months is in large part due to rising levels of above-ground stockpiles. In recent years there has been a strong inverse correlation between the stockpile levels and the market price. As these stockpile levels rise, varying degrees of supply risk premiums are shed from the prices.
But even as base metals prices retreat, their bull markets must be viewed in strategic context. They are in fact secular in nature because of a fundamental supply and demand imbalance. Huge commodities demand out of Asia has pinched supplies so that the producers of these commodities are hardly able to keep up.
And because of the nature of “hard” commodities, or non-renewable natural resources, the suppliers' ability to meet demand at a higher level is not an easy feat. It takes many years to discover, develop and construct new mines to replace the depleted mines and scale production upwards. And because of so many years of inactivity in this area during the commodities bear of the late 1980s and 1990s, the suppliers are behind the eight-ball.
So when looking at the base metals' weakness of late, consider their entire bull markets. Though prices today are well off their highs, they are still far above their lows around the turn of the century. And even though stockpile levels are on the rise, for the most part they are still well below the levels of comfort that we saw just a few short years ago. The interim fundamental noise of the stockpile/price inverse correlations should not be construed as a breakdown of long-term fundamentals.
And corrections are not only healthy but necessary in bull markets. The monstrous gains we've witnessed in base metals the last several years were indeed driven by fundamentals, but these gains also had sizeable speculative risk premiums attached to them. In order to rebalance sentiment it is essential to shed the euphoria surrounding the base metals and bring some fear back into these markets.
Even if there is more room to run on the downside, the base metals still remain in long-term upward trends. And even at today's prices the mining companies bringing these metals to market should remain extremely profitable.
At Zeal we have profitably traded the stocks of many of these mining companies in our newsletters and are waiting for an opportune time to redeploy as base metals continue their secular run higher. If you are looking for cutting-edge commodities-market analysis and stock trades, subscribe today to our acclaimed monthly newsletter .
As a newsletter subscriber you also gain access to the exclusive subscriber charts section on our website. We update an assortment of short-term and long-term base metals charts. And our subscribers have been able to watch the stockpile/price correlations unfold right before their eyes via weekly updates of the charts you see above.
The bottom line is the LME base metals stockpiles data continues to provide us with valuable information on these volatile markets. With base metals prices trending down in recent months, we've been able to look to the stockpile levels to explain these movements. Global stockpiles are on the rise, and this has helped ease the huge supply crunch in the tight base metals markets.
But while these stockpile builds have led to the shedding of some of the speculative risk premiums attached to the prices of the base metals, their respective bull markets remain healthy. Prices are still on the high side of their secular uptrends and stockpile levels are still historically low. A base metals correction is healthy in order to balance sentiment for the next push higher.
By Scott Wright
So how can you profit from this information? We publish an acclaimed monthly newsletter, Zeal Intelligence , that details exactly what we are doing in terms of actual stock and options trading based on all the lessons we have learned in our market research as well as provides in-depth market analysis and commentary. Please consider joining us each month at … www.zealllc.com/subscribe.htm
Thoughts, comments, or flames? Fire away at scottq@zealllc.com . Depending on the volume of feedback I may not have time to respond personally, but I will read all messages. Thanks!
Copyright 2000 - 2007 Zeal Research ( www.ZealLLC.com )
Zeal_LLC Archive |
© 2005-2022 http://www.MarketOracle.co.uk - The Market Oracle is a FREE Daily Financial Markets Analysis & Forecasting online publication.
Comments
|
rajesh jain
23 Feb 10, 04:40 |
copper trend 2010
please inform the copper trend in 2010 |
|
karpagaraj
18 Mar 10, 04:12 |
zinc trend
Sir, kindly,send me the details of trend about the zinc in this year |


