Stock Market Report: Pass the Band-aides!
Stock-Markets / Stock Markets 2011 Dec 10, 2011 - 04:51 AM GMTBy: UnpuncturedCycle
 Lost in all the noise regarding the European summit was this morning's Commerce Department report that the U.S. trade deficit narrowed by 1.6% in October to $43.5 billion. The deficit has narrowed for four straight months to the lowest monthly trade gap this year. Underlying the report was a sharp upward revision to the trade deficit in September to $44.2 billion from the initial estimate of $43.1 billion. The October trade deficit was close to the consensus forecast of Wall Street economists of $43.6 billion. Both imports and exports declined in October, with imports falling at a slightly faster pace.¹ The U.S. trade deficit with China widened to $28.1 billion in October in compared with $25.7 billion in the same month last year. October imports from China were the highest on record. The data show that trade with Japan has recovered from last March's earthquake and subsequent tsunami. Imports from Japan in October were the highest since April 2008 while exports to Japan were the highest since March 1997.
If we look East toward China, one of the US's largest trading partners, we see that things continue to slow but at an accelerating pace:
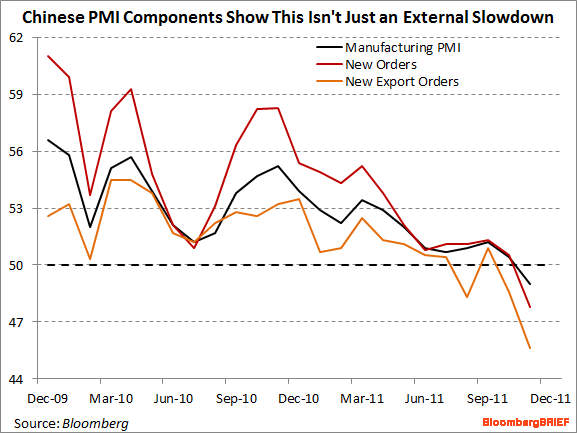
The latest PMI components show that the slowdown is also a product on internal stresses in the Chinese economy as falling real estate prices take a toll. In a separate note Hong Kong may need to stand behind some banks and deposits should Europe's sovereign debt crisis worsen and cause the global economy to slump, this according to Nigel Chalk, the International Monetary Fund's China mission chief. In a "very bad scenario" the government may have to "perhaps guarantee some of the deposits in the banking system as they did in 2008 in the wake of Lehman Brothers," Chalk said in a Bloomberg Television interview from Washington. Hong Kong must be ready to provide "significant and immediate" fiscal stimulus that could include tax cuts, subsidies for the poor and rolling back some property curbs, the IMF report said.
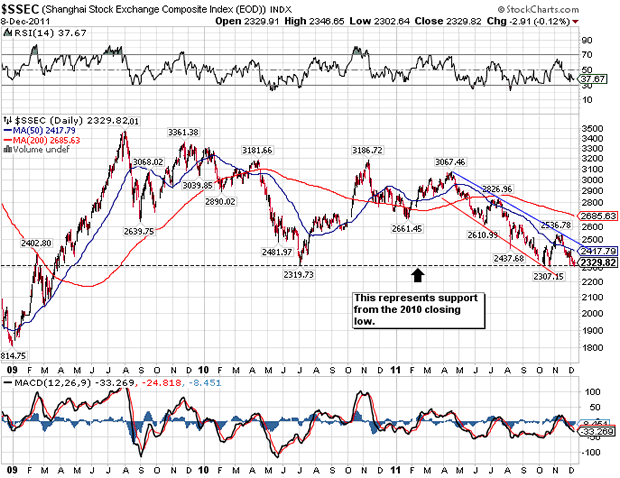
The Shanghai Stock Exchange has struggled right along with the Chinese economy and, although not shown on this chart, last night it closed at 2,315 a new multi-year closing low. You have to go back to early 2009 and the height of the US credit crisis to find a lower close. If we have a recovery and actual growth as many claim, how come the world's economic engine is sputtering?
Meanwhile in Europe the ECB disappointed investors yesterday by failing to address the issue of buying back sovereign debt, and today the European Union began its summit announcing that seventeen nations had agreed to form a new fiscal union and some one somewhere would contribute an addition 200 billion Euros to buy back sovereign debt. This is far short of the trillions needed and is
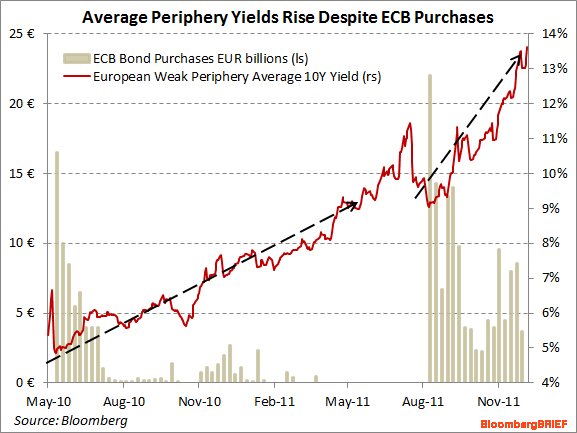
forcing the weaker Euro nations to pay higher and higher yields every time they go to the well for additional funding. Additionally, Italy's ten-year yield jumped from less that 6% yesterday morning to just above 6.5% this afternoon as investors start to see the handwriting on the wall.
Of course everyone applauded the European accord and the central banks went out and propped up the stock markets, and that includes the Dow as it trades up 150 points at 12:15 pm EST:
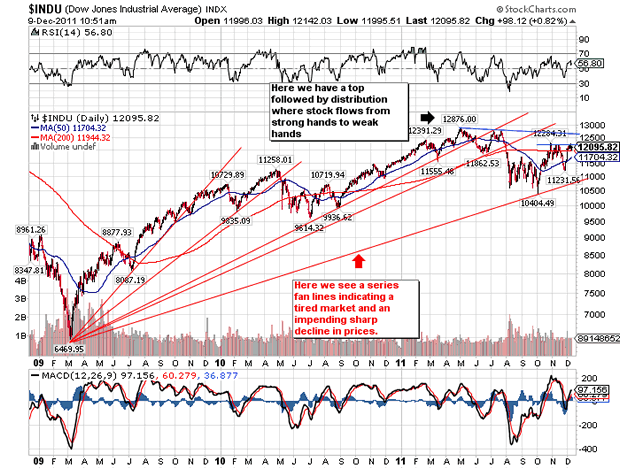
Unfortunately for anyone buying stocks we see absolutely no improvement in the long-term outlook. The April closing high is still the high and it still looks and smells like distribution as the five fan lines indicate in the previous chart. Volume on rallies is pathetic and of late the Transports have been declining on days the Dow has rallied. The Transports have been leading the Dow for years and when they diverge away from the Dow it is almost always an indication of lower stock prices to come.
Right now the Dow is trying for the sixth consecutive day to close above good resistance at 12,200 as you can see here:
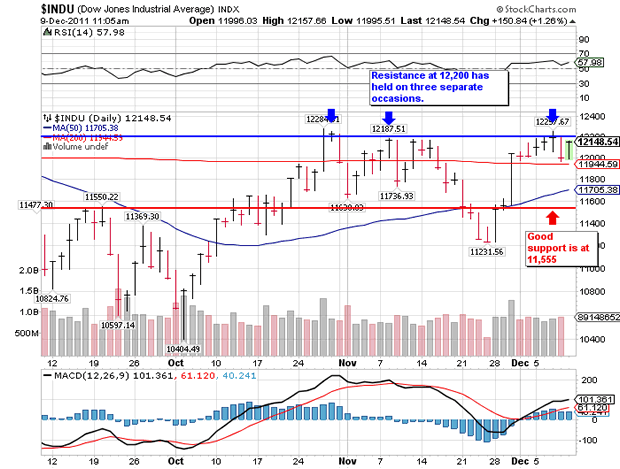
This is the third time since late October that the Dow has tried to break out above this resistance and the previous two were failures. On the down side we have good support at 11,555. Even if they manage to surpass 12,200 they will have significant resistance from the neckline at 12,305 and the euphoria from the European agreement, without the approval of the UK, Sweden and two other nations, will have worn off. I am short from 12,156 in the Dow and will remain short as long as the Dow doesn't close above the neckline mentioned previously.
Giuseppe L. Borrelli
www.unpuncturedcycle.com
theunpuncturedcycle@gmail.com
Copyright © 2011 Giuseppe L. Borrelli
- All Rights Reserved Disclaimer: The above is a matter of opinion provided for general information purposes only and is not intended as investment advice. Information and analysis above are derived from sources and utilising methods believed to be reliable, but we cannot accept responsibility for any losses you may incur as a result of this analysis. Individuals should consult with their personal financial advisors.
© 2005-2022 http://www.MarketOracle.co.uk - The Market Oracle is a FREE Daily Financial Markets Analysis & Forecasting online publication.


