Continuation of Commodities Bull Markets During 2008 - Stocks to rise on Inflation
Commodities / Resources Investing Dec 28, 2007 - 02:40 AM GMTBy: Brian_Bloom
 A New Ballgame - Summary and Conclusions
Almost unanimously, the indicator charts are signalling the imminent emergence of a new ballgame. Commodities in general, and oil and gold in particular have already broken up, whilst the Industrial Equity Indices and the US Dollar are showing nail biting indecision.
The oil price is looking dangerously close to breaking up through the $100 per barrel level; and also looks like it is about to break up relative to gold.
Whilst it could be argued that the patterns on the Industrial Charts are bearish, there is an underlying subtlety which cannot be ignored – specifically, underlying volume patterns are at odds with the price patterns. Given this anomaly, the industrial equity charts may surprise many technical analysts by breaking “up” notwithstanding the apparently bearish patterns.
There is no question that such a development would be counterintuitive. If the Industrials break up to follow the key commodities, then the only logical explanation which this analyst might offer is that the economy will split itself into two sectors:
- The investment sector will begin to show signs of inflation as too much paper money chases too few investment opportunities
- The Industrial/Commercial sector will begin to show signs of stagflation as prices charged to customers by businesses rise in the face of stagnating or falling volumes. Profits will rise in dollar terms but will fall in real terms. Should this happen, it will have serious implications, in that it might be a harbinger to a slowing “velocity of money”. In turn, a slowing velocity of money could eventually bring the US (and world) economy to its knees.
The US Dollar looks like it is about to come under renewed pressure and US interest rates might begin to rise as the market “forces” an adaptation to inflationary pressures.
Unless something structurally different begins to emerge, in context of rising inflation, rising interest rates, falling property prices and a heavy debt load, the US consumer in particular is not facing a particularly happy medium term future.
At the core of any proposed solutions to the above scenario will lie the need to migrate to new energy paradigms that are more powerful and lower cost than fossil fuels.
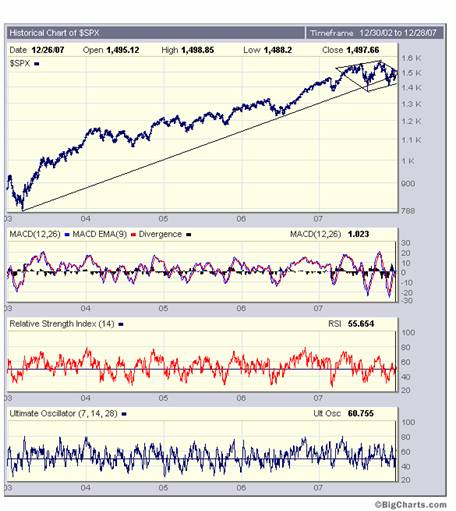
The chart below of the Standard & Poor Industrial Index (courtesy Bigcharts.com) shows a diamond formation which, typically is bearish, but could also be seen, in hindsight, to have been a continuation pattern.
The weekly chart below of the Dow Jones Industrial Index is very difficult to interpret. From a bearish perspective, the trendline A-B has been penetrated on the downside, and the line E-F might be argued to be the neckline of an emerging Head and Shoulders pattern – which is invariably bearish (if it is indeed such a pattern). Further, line C-D is offering resistance to further upside – which might “force” a pullback towards the neckline E-F.
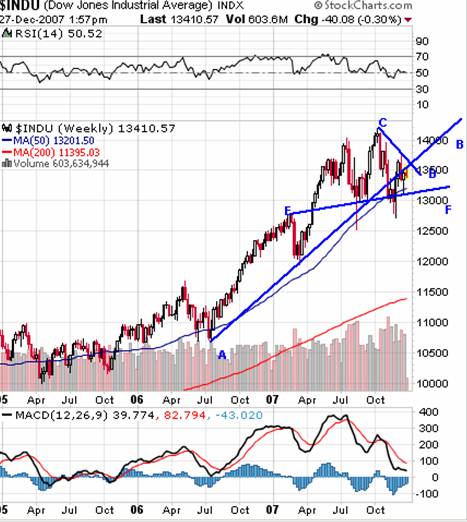
The problem with this argument is that the volume patterns do not confirm, and it is suggested that reader examine the volume patterns very carefully against the theoretical patterns which should be manifesting in line with the chart which has been reproduced below from Edwards and Magee's book entitled Technical Analysis of Stock Trends. Volumes should have been rising on the left shoulder and head, and they did exactly the opposite.
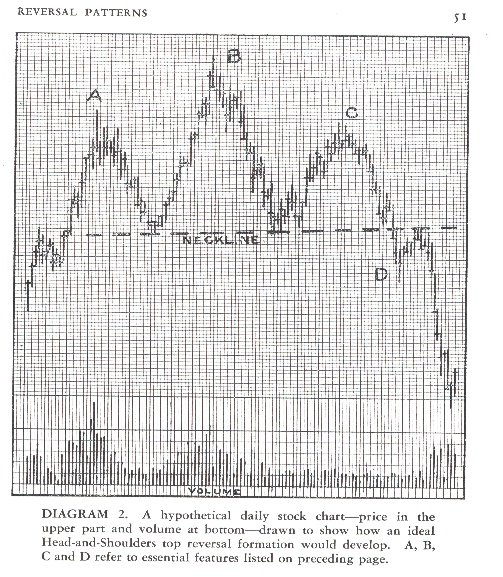
In this context, it is recommended that reader remain extremely vigilant. Given the underlying weakness in the economy, one would intuitively expect the industrial markets to break down, but (as a sweeping statement) the markets are designed to part the average punter from his money. A break- up from these levels might be extremely painful to those bears who have shorted the market.
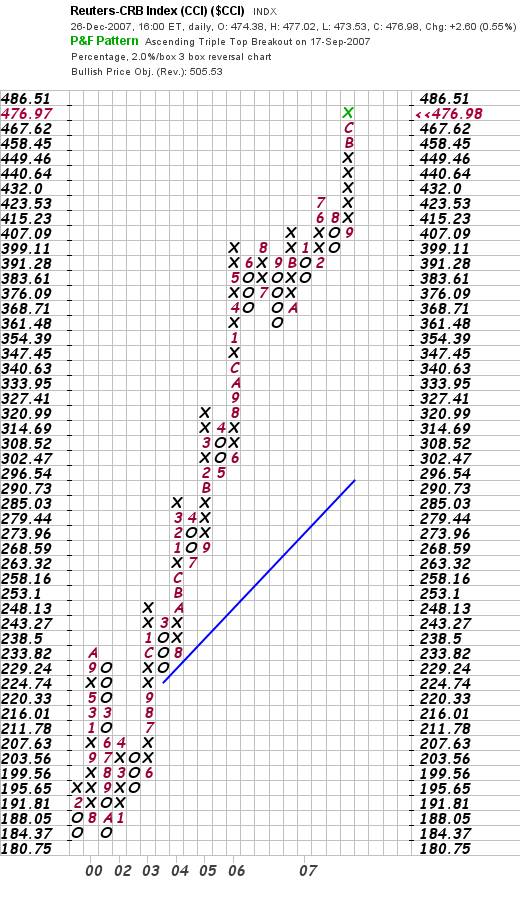
Now, if what we are witnessing is a “bear trap”, what could be the logical explanation? The chart below (courtesy Stockcharts.com) might offer a clue. Commodity prices are breaking up (in dollar terms) and we might find ourselves on the brink of a breakout of inflation.
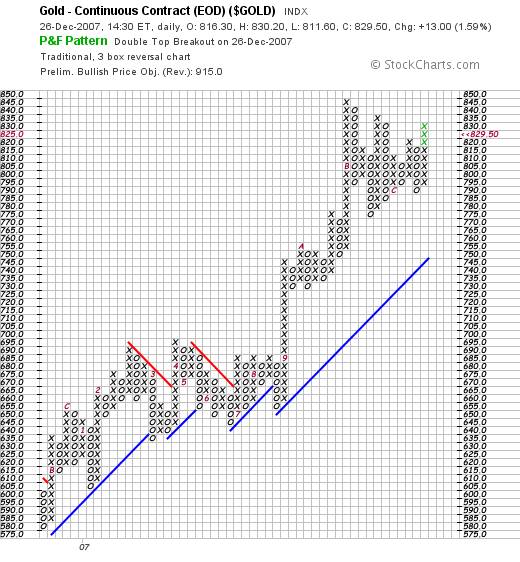
Traditionally, gold is the “safe haven” protection against inflation, and it can be seen from the chart below that the gold price has indeed broken up – with a short term price objective (based on horizontal count target) of $860 and a medium term objective of $915 an ounce.
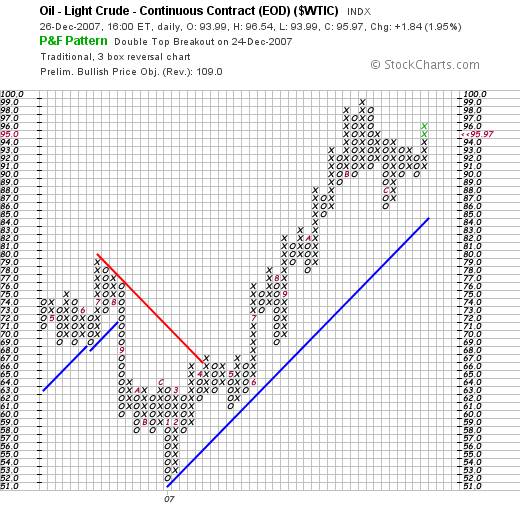
But gold price is not yet ready to be seen as “the” safe haven, given the following two charts. In the first chart, it can be seen that the oil price has also broken up and both the horizontal and vertical techniques are calling for a price above $100 a barrel.
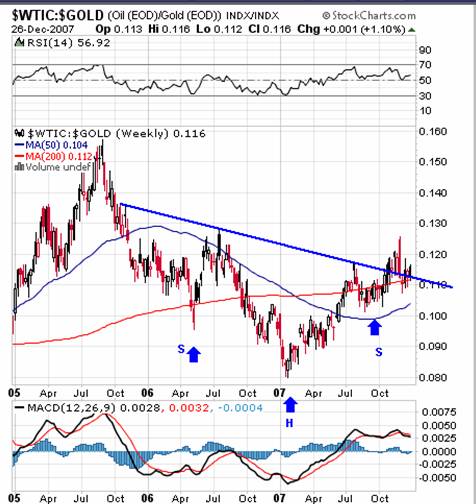
It is the chart below that is most concerning from the perspective of its impact on the economy. This chart “might” be reflecting a reverse head and shoulders – implying that the oil price might rise by up to 33% relative to gold. (In the medium term)
One reason for this might be related more to pragmatism rather than theory. The chart below shows that the US Dollar may have a long way down yet to travel. Whilst this is happening, the oil price might rise in dollar terms merely to compensate.
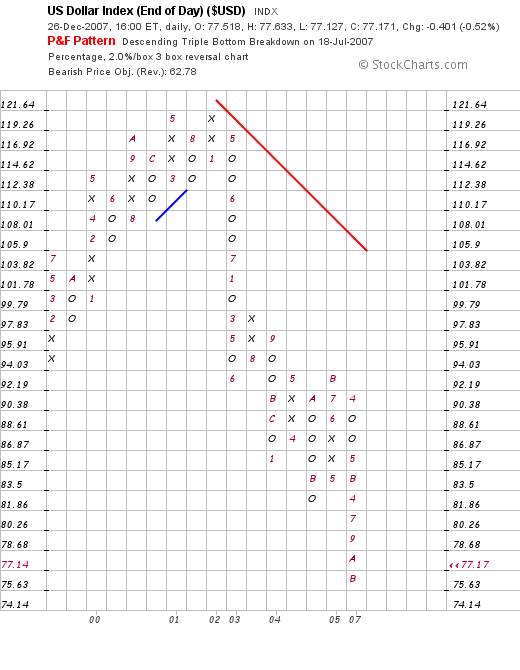
A dollar in free fall cannot reasonably be tolerated by the markets given that it will give rise to rampant inflation within the US borders. No (sane) lender will continue to lend at low rates if the value of his loan capital is being eroded by inflation and if the income is less than the inflation rate. Lenders would find themselves going out backwards.
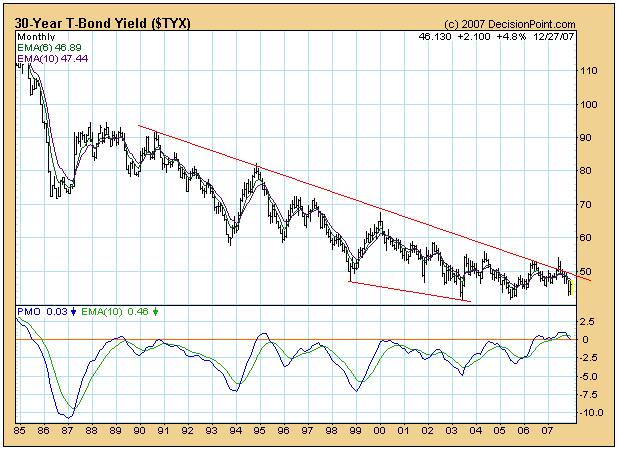
The reader's attention is drawn to the monthly chart of the 30 year bond yield below – in particular the oscillator, which has been showing a series of rising bottoms since 1999. Vested interests (Central Banks) have been fighting rising yields, but the market juggernaut has been quietly positioning itself against the Central Banks.
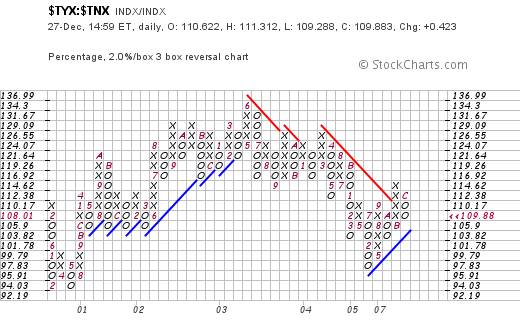
That the “behind the scenes” move has been quiet and subtle is evidenced by the following two charts which show long term yields relative to short term yields. Yes, the 30 year yield has recently been falling relative to the ten year yield, but the reader's attention is drawn to the last blue line. The trend is still inflationary. (i.e 30 year yield rising faster than 10 year yield)
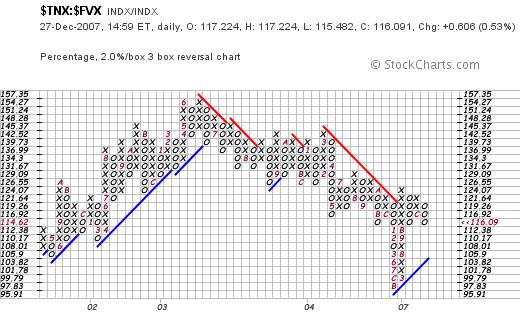
A similar situation exists of the ten year yield relative to the five year yield. Yes, one could argue that the ratio has more downside potential than upside (if one was arguing from a trader's ment ali ty), but it could also be argued that this chart is much stronger than the one above. It depends on one's point of view.
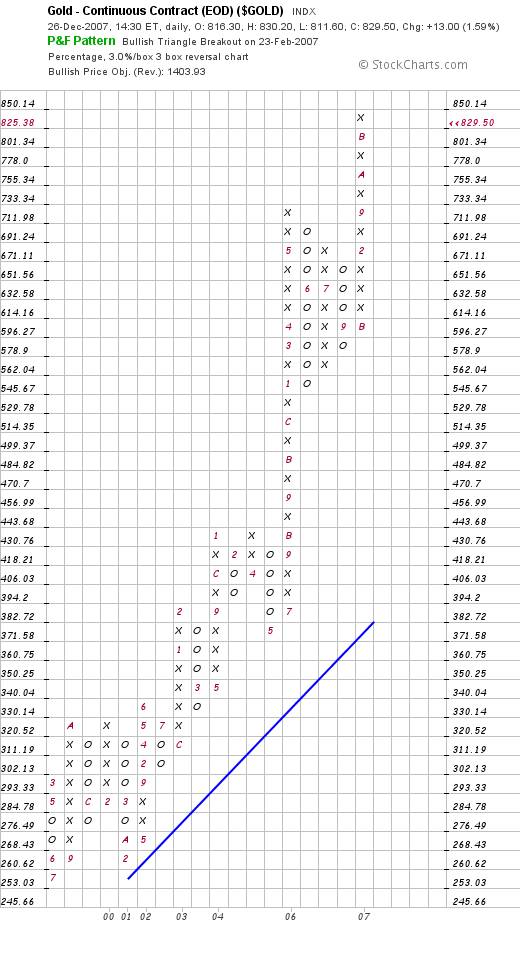
In the end analysis, however, the chart below is the most damning of all. Although it does not make any reference to time, it is anticipating that (once the dust has settled) the gold price will rise to over $1,400 an ounce.
None of the above is “cast in concrete”, but the balance of probabilities at this stage favours a breakout of inflation and a slowing of the velocity of money.
All of this begs the question: “So what do we do about this?”
Frankly, I have less interest in what the wealthy will do to protect their wealth than what the authorities might do to protect the “cannon fodder” – those ordinary people who are facing ruination because they were too trusting of the authorities. Since 1913, the playing field has been artificially skewed by the bankers whose logic was more driven by ration ali sation than re ali ty. Theoretically, the wealth game was open to everyone to play. It was merely a game of “survival of the fittest”. If you had it in you, and you played by the rules, you too could become rich. Where the bankers went wrong is they confused “money” with “wealth”. They forgot the parable of King Midas. “ he found to his dismay that whether he touched bread, it hardened in his hand; or put a morsel to his lips, it defied his teeth. He took a glass of wine, but it flowed down his throat like melted gold.” ( http://en.wikisource.org/wiki/The_Age_of_Fable/Chapter_VI )
Money is not the same as wealth. To be wealthy one has to focus on qu ali ty of life and to achieve an improved qu ali ty of life, the entire population needs to be both contributing and benefiting. At the end of the day, numbers always prevail. At the end of the day, history shows us that the disenfrachised always (eventually) rises up in revolt against the priviledged few.
The solution to a slowing economy lies in a migration to new energy paradigms which are more powerful and lower cost than Fossil Fuels. Trying to “fix” the economy with money whilst ignoring the industrial re ali ties is like trying to weigh an elephant on a bathroom scale. Eventually, unless you replace the bathroom scale with an industrial strength scale, the scale breaks.
Its not rocket science, but it does require a field of vision that extends beyond the next elections. For a host of reasons we need to move away from fossil fuels, and for another host of reasons we should not be moving to nuclear fission. One reason is that nuclear fission energy cannot stimulate industrial activity in the same way oil and coal did. There will not be nuclear fission powered motor cars, for example. At the end of the day, “sustainable” industrial growth is the only way to build a healthy economy.
By Brian Bloom
www.beyondneanderthal.com
Since 1987, when Brian Bloom became involved in the Venture Capital Industry, he has been constantly on the lookout for alternative energy technologies to replace fossil fuels. He has recently completed the manuscript of a novel entitled Beyond Neanderthal which he is targeting to publish within six to nine months.
The novel has been drafted on three levels: As a vehicle for communication it tells the light hearted, romantic story of four heroes in search of alternative energy technologies which can fully replace Neanderthal Fire. On that level, its storyline and language have been crafted to be understood and enjoyed by everyone with a high school education. The second level of the novel explores the intricacies of the processes involved and stimulates thinking about their development. None of the three new energy technologies which it introduces is yet on commercial radar. Gold, the element , (Au) will power one of them. On the third level, it examines why these technologies have not yet been commerci ali sed. The answer: We've got our priorities wrong.
Beyond Neanderthal also provides a roughly quantified strategic plan to commerci ali se at least two of these technologies within a decade – across the planet. In context of our incorrect priorities, this cannot be achieved by Private Enterprise. Tragically, Governments will not act unless there is pressure from voters. It is therefore necessary to generate a juggernaut tidal wave of that pressure. The cost will be ‘peppercorn' relative to what is being currently considered by some Governments. Together, these three technologies have the power to lift humanity to a new level of evolution. Within a decade, Carbon emissions will plummet but, as you will discover, they are an irrelevancy. Please register your interest to acquire a copy of this novel at www.beyondneanderthal.com . Please also inform all your friends and associates. The more people who read the novel, the greater will be the pressure for Governments to act.
Copyright © 2007 Brian Bloom - All Rights Reserved
Brian Bloom Archive |
© 2005-2022 http://www.MarketOracle.co.uk - The Market Oracle is a FREE Daily Financial Markets Analysis & Forecasting online publication.


