Are the Stars Aligned for a Stock Market Year-End Rally?
Stock-Markets / Stock Markets 2011 Dec 06, 2011 - 09:45 AM GMTBy: Frank_Holmes
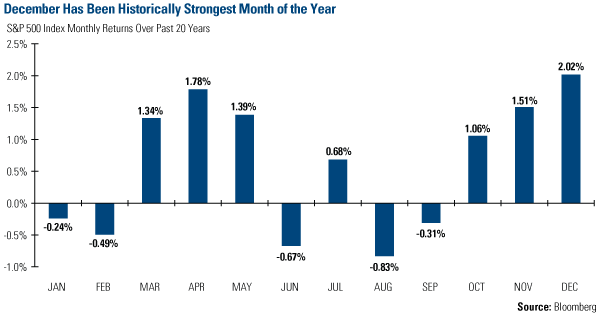
 December has historically been one of the strongest months of the year for equity markets. Taking a look over the past 20 years, the S&P 500 Index in December has averaged 2 percent.

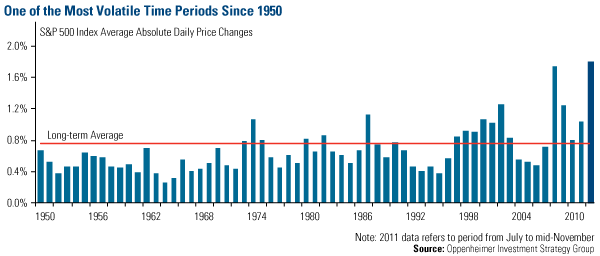
This year has been extraordinarily turbulent, though. In fact, 2011 ranks “among the most volatile market years on record,” says Oppenheimer. When you look at the average absolute daily price changes of the S&P 500, you’ll see that the period from July through the middle of November averaged 1.8 percent. This is about a percent higher than the 60-year average, and just barely above 2008’s daily price changes. The fact is a little less significant when you consider that the 2008 number represents the entire year. Regardless, stock prices have been turbulent.

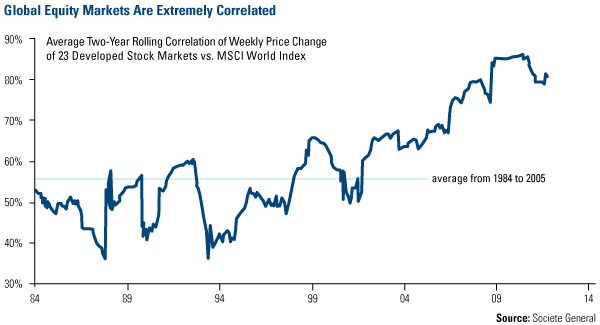
The S&P 500 isn’t the only index with extreme volatility, as stock markets around the world have been extremely correlated. Take a look at the chart below, which tracks the average two-year rolling correlation between the weekly price change of 23 different developed stock markets and the MSCI World Index. Stock price correlation has remained above 80 percent since 2009—the highest over the 25-year period. Gloom Boom & Doom Editor Marc Faber says that he can’t “recall in the forty years that I have been working in the investment business, equity markets which were this correlated.”

We believe that correlations will decrease along with volatility as we get more clarity on the eurozone crisis and see signs of stability in the global economy. Our investment team noted that volatility fell this week, with the CBOE Volatility Index (VIX) declining 20 percent. This could be related to the news that November U.S unemployment unexpectedly dropped to 8.6 percent, U.S. auto sales in November were the strongest in more than two years, and preliminary data on holiday retail sales appears to be strong. According to Bloomberg News, Black Friday sales hit a record high this year, with consumers spending $11.4 billion.
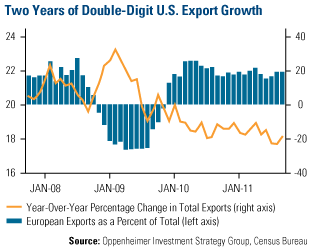
Oppenheimer is one bull on U.S. equities, as the firm believes that investors have overestimated the negative impact the crisis in Europe has on the U.S. economy and corporate profitability. Oppenheimer points to the fact that the U.S. is less reliant on Europe, with only 18 percent of U.S. exports heading across the Atlantic. This has fallen from 23 percent over the past two years. Meanwhile, U.S. export growth has averaged “double-digit year-over-year growth since the end of 2009,” says Oppenheimer.

“Corporate America remains a pillar of potency and stability,” says Oppenheimer.
Multinational companies have diversified their revenue streams by heading into fast-growing markets while still keeping their costs under control, says Oppenheimer. Additionally, cash remains at record highs, which provides a cushion to handle unforeseen issues.
Positive news came out of China this week too. For the first time in three years, the People’s Bank of China announced a cut in the reserve requirement ratio (RRR) by 50 basis points. This is a step in the right direction, says Director of Research John Derrick, as China tries to balance too-low growth with too-high inflation. Over the past three years, China has been raising the RRR to curtail loan growth, and this cut is the first step to promoting loan growth. The RRR cut was also a part of a global central bank coordination to make sure there was enough liquidity in the system, says John.
China’s RRR cut happened a month sooner than ISI expected, but the stars may be aligning in China. If you look at where the country’s purchasing managers’ index, the leading economic indicators level and inflation were during the last RRR cut three years ago, these figures were all about where they are now, says ISI.
The energy sector continues to see merger and acquisition activity (See a previous discussion in Case Study: Buyouts Crystallize Value in the Market). In November, a pipeline deal was announced between Enbridge and Enterprise Products Partners, causing West Texas Intermediate (WTI) oil prices to jump. As a result of the companies’ agreement, oil which had been flowing from the Gulf Coast to the Midwest will actually be reversed. Now, the landlocked crude in Cushing, Oklahoma will be delivered to the refiners in the Houston-area. The Wall Street Journal says, the 500-mile line “could ship an initial 150,000 barrels of crude per day by the second quarter of next year.”
Evan Smith, co-manager of the Global Resources Fund (PSPFX), discussed the effect on WTI oil prices with Yahoo the week the deal was announced. Evan says that for several months there’s been a discount in the West Texas Intermediate compared to Brent crude oil. Now that the glut of oil parked in the Midwest will move to the Coast, sentiment improved and WTI pricing moved more in line with Brent crude.
Lately investors have been inundated with negative news surrounding Europe. It’s important to put these facts in perspective along with other positive signs in the market, including those that we are seeing in the U.S., China and the energy sector. While the past two turbulent years have made it difficult for investors to remember the benefits of long-term investing, Oppenheimer believes that, “when the future return potential of an asset class is widely doubted, the exact opposite tends to occur.” We agree with this statement, as we believe great opportunities can be found during turbulent times like today.
John Derrick, director of research, contributed to this commentary.
For more updates on global investing from Frank and the rest of the U.S. Global Investors team, follow us on Twitter at www.twitter.com/USFunds or like us on Facebook at www.facebook.com/USFunds. You can also watch exclusive videos on what our research overseas has turned up on our YouTube channel at www.youtube.com/USFunds.
By Frank Holmes
CEO and Chief Investment Officer
U.S. Global Investors
U.S. Global Investors, Inc. is an investment management firm specializing in gold, natural resources, emerging markets and global infrastructure opportunities around the world. The company, headquartered in San Antonio, Texas, manages 13 no-load mutual funds in the U.S. Global Investors fund family, as well as funds for international clients.
All opinions expressed and data provided are subject to change without notice. Some of these opinions may not be appropriate to every investor.
Standard deviation is a measure of the dispersion of a set of data from its mean. The more spread apart the data, the higher the deviation. Standard deviation is also known as historical volatility. All opinions expressed and data provided are subject to change without notice. Some of these opinions may not be appropriate to every investor. The S&P 500 Stock Index is a widely recognized capitalization-weighted index of 500 common stock prices in U.S. companies. The NYSE Arca Gold BUGS (Basket of Unhedged Gold Stocks) Index (HUI) is a modified equal dollar weighted index of companies involved in gold mining. The HUI Index was designed to provide significant exposure to near term movements in gold prices by including companies that do not hedge their gold production beyond 1.5 years. The MSCI Emerging Markets Index is a free float-adjusted market capitalization index that is designed to measure equity market performance in the global emerging markets. The U.S. Trade Weighted Dollar Index provides a general indication of the international value of the U.S. dollar.
Frank Holmes Archive |
© 2005-2022 http://www.MarketOracle.co.uk - The Market Oracle is a FREE Daily Financial Markets Analysis & Forecasting online publication.


