Why Gold Stocks Have Underperformed and What Lies Ahead
Commodities / Gold & Silver Stocks Dec 06, 2011 - 05:24 AM GMTBy: Jordan_Roy_Byrne
 Gold is higher by 20% this year but the large cap gold stocks (GDX) are down 6% while the junior gold stocks (ETF) are down 25%. With Gold higher by 20%, we’d normally expect the gold stocks to be up 50% and more. Needless to say 2011 has been a difficult year for gold bugs. Its been a near disaster for most junior gold stocks. That being said, there are important but often ignored reasons why the gold shares have underperformed this year and reasons to consider why a big move may be only months away.
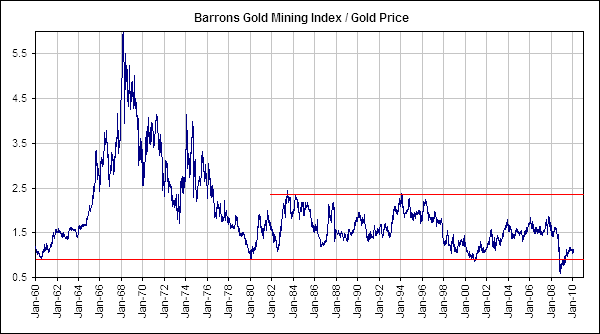
First, we have to understand that gold mining is a very difficult business. The law of numbers makes it even more difficult for the largest producers. They have to operate multiple mines and then continuously acquire or find new resources to maintain reserves and maintain production levels into the future. It’s a difficult business regardless of where the Gold price is. Hence, mining stocks do not outperform Gold over time whether in a bull market or not. The following chart is from Steve Saville who is one of the first to understand this subject. The surge in the 1960s was due to the Gold price being fixed.
Also we must understand that Gold and gold stocks are entirely different markets that share different performance in a panic or crisis. Gold can be a safety hedge but gold stocks most certainly are not. They are the worst performers in any type of crisis. During the 1987 stock market crash, the gold stocks performed far worse than the market. The same happened in 2008 as the gold miners led the market crash.
During the present European sovereign debt crisis, the gold stocks have actually held up reasonably well relative to other stocks. From top to bottom, emerging markets and commodity shares have been hit the hardest while gold stocks declined in line with the S&P 500. Keep in mind we are referring to the gold stocks as in the large producers. The senior gold stocks are notoriously volatile but the hundreds of mid-tier and junior companies are far more volatile than the seniors. If the seniors fall 15-20% then others can fall 40% or more.
Moving along, one has to consider which is the best market index for tracking the gold stocks. We posit this as there are several indices but all are composed differently and therefore their performance is not always in line with each other. In the chart below we plot GDX, XGD.to, XAU and SIL. Note that GDX mirrors the HUI which is about 10% comprised of silver stocks. The XAU is comprised of 20% silver stocks and base metal stocks (FCX) while SIL, the silver stock ETF is 100% silver stocks. XGD is 100% in gold stocks and is priced in Canadian Dollars.
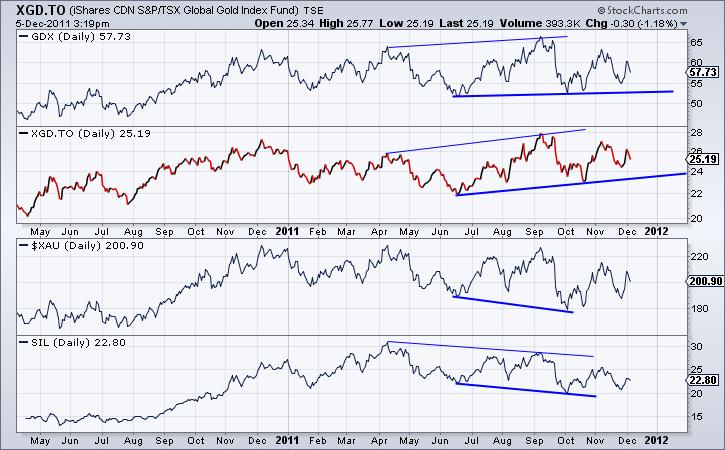
Judging from this we see that the weakness is almost entirely in silver stocks and not in gold stocks. XGD is holding up the best and is little threat to break its summer lows while XAU and SIL are in downtrends that began in April and printed new lows in October. Though the gold stocks have underperformed Gold, note that XGD and GDX did make new, albeit marginal highs in September. The reality is during a tough year gold stocks have held up relatively well while silver stocks and smaller mining stocks have trended down.
The gold stocks (GDX & XGD) have actually been in a consolidation that shares similarities to the consolidation from 2004-2005. See the chart below.
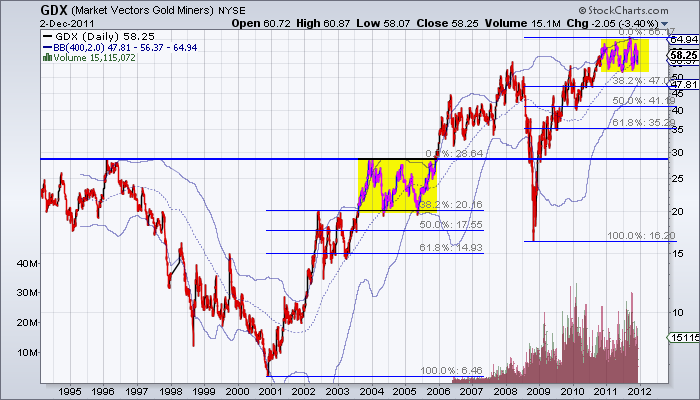
The consolidation in 2004-2005 lasted 18 months and broke to a new high 23 months after the peak at the end of 2003. The 2001-2003 advance lasted 36 months and gained nearly 350%. The 2009-2010 advance gained 313% in 25 months. Based on time, the current consolidation would bottom this month and then break to a new high in March 2012. We should also note that the first consolidation bottomed at the 38% retracement and the lower 400-day band. The lower 400-day band is currently at $48 and should touch $51 by the end of January while the 38% retracement is at $47.
The similarities between this consolidation and the 2004-2005 consolidation indicate that the gold stocks are in a consolidation and digesting the rapid rebound gains from 2009-2010. This along with the aforementioned reasons explains why the gold stocks have not broken out to new highs. Moreover, while not as strong as it was this year, Gold did make a new high in 2004 while the gold stocks lagged as they were stuck in a consolidation having to digest the massive gains from 2001-2003. That is another key similarity between the two periods.
There is plenty of evidence that confirms we are likely in the latter stages of this consolidation.
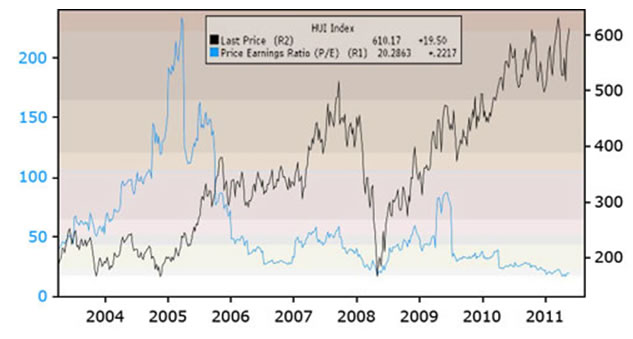
Here is a chart posted by my friend Sean Brodrick. It shows the HUI index along with the price earnings ratio of the index. The PE ratio is currently at its lowest point in nearly nine years.
The next chart is from sentimentrader.com. It plots the Rydex Precious Metals Fund in line with the assets in the fund and the assets as a percentage relative to other sectors. As we can see, the assets in the fund are near an absolute low while relative to other sectors the assets are much closer to a low than a high.
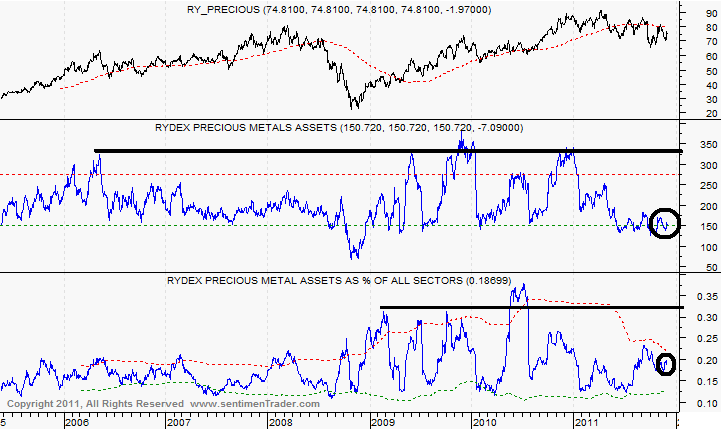
To conclude, the gold stocks have underperformed for a variety of reasons. Historically, it is what they tend to do- underperform. Secondly, the gold stocks have been stuck in a consolidation, digesting the rapid gains the post 2008 recovery. Third, the consolidation came about at a time when the first major aftershock from 2008 came to the forefront. The European sovereign debt crisis took equities and commodities lower and historically, the gold stocks are never spared from a panic or crisis.
The good news is the gold equities are coming to the end of the consolidation and a resolution within months is likely. Sentiment is bullish from a contrary perspective. The consolidation has weeded out the week and impatient as earnings and cash flows for gold companies have improved and stock valuations have moved to multi-year lows. Even in Gold and Silver we see that speculative long positions are near multi-year lows. This setup combined with the forthcoming monetization in Europe, stimulus in China and more monetization from Bernanke could produce quite the launch pad for the gold shares in early 2012. We invite you to learn more about our service.
Good Luck!
Jordan Roy-Byrne, CMT
Trendsman@Trendsman.com
Subscription Service
Trendsman” is an affiliate member of the Market Technicians Association (MTA) and is enrolled in their CMT Program, which certifies professionals in the field of technical analysis. He will be taking the final exam in Spring 07. Trendsman focuses on technical analysis but analyzes fundamentals and investor psychology in tandem with the charts. He credits his success to an immense love of the markets and an insatiable thirst for knowledge and profits.
© 2005-2022 http://www.MarketOracle.co.uk - The Market Oracle is a FREE Daily Financial Markets Analysis & Forecasting online publication.


