


Economic Armageddon: 2012 or 2013?
Economics / Great Depression II Dec 05, 2011 - 09:01 AM GMTBy: Clif_Droke

 In his latest report, Samuel Kress of SineScope reviewed the 120-year cycle and broke it down into its constituent cycles. For the sake of our long time readers, I’m providing my own breakdown of the 120-year cycle and its effects on the past, present and future of the financial market and economy.
The 120-year Mega Cycle first began in the mid 1770s after a prolonged depression and the Revolutionary War, from which our nation was born. Mr. Kress has historically referred to the 120-year cycle as the Revolutionary Cycle since it always portends a revolution of either government or the nation’s way of life. The current 120-year cycle is scheduled to bottom in late 2014, yet already we’re witnessing preliminary signs of this revolutionary unrest in the form of protests and occupation movements across the U.S. and around the world.
The 120-year Mega Cycle is also known as the Grand Super Cycle and is composed of two 60-year super cycles. Sixty years approximates to an average economic long wave (or K-wave). This also encompasses the biblical Jubilee Cycle of 50 years, which is the cycle of release from debt obligations. In modern times a generation is defined as being roughly 20 years. This means that in any given 60-year cycle three generations pass and fulfills the old saying, “From shirtsleeves to shirtsleeves in three generations.” Thus we can see that a complete cycle of 60 years normally sees a complete revolution of the economy, from poverty to riches and back to poverty again.
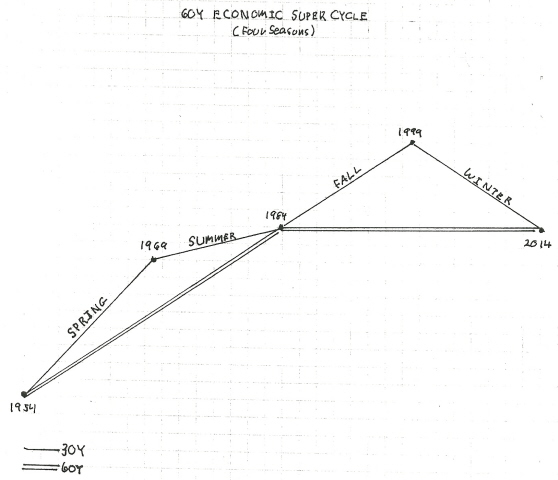
The 60-year cycle is composed of two 30-year mini super cycles. There are four 30-year cycles in a complete 120-year cycle. The latest 30-year cycle – the final one of the current 120-year cycle – peaked in late 1999 and is scheduled to bottom in late 2014 along with the 120-year cycle. The 1999 peak of the latest 30-year cycle coincided with the stock market’s orthodox top of 1,555 in the S&P 500 index. This peak also kicked off a historic 15-year secular bear market which should carry into late 2014.
Mr. Kress has emphasized that the 1/8 (12.5%) of a cycle’s duration is its “hard down” phase. He writes, “Applied to the 120-year [cycle] is 15 years which began the ‘hard down’ phase of the historic high. This could be considered the peak of our economy. Applied to the 60-year (economics) super cycle is 7 ¾ years. Added to later 1999 is earlier 2007 when an effective double top occurred. This began economic decline. Applied to the 30-year is 3 ¾ years, and added to earlier 2007 is the end of 2010/beginning of 2011 for the final ‘hard down’ phase of the economy to form the 120-year bottom in later 2014.”
The next cycle of significance below the 30-year cycle is the 12-year cycle, which Kress identifies as the primary directional cycle. Its half cycle is the 6-year secondary directional cycle. The tenth and final 12-year cycle of the current 120-year cycle peaked in September 2008 during the worst part of the credit crisis. According to Kress it can be considered the beginning of economic instability.
The 6-year cycle is the smallest yearly cycle which Kress recognizes. Its peak was scheduled for late September but was foreshortened by the other yearly cycles as well as weekly cycle influences, producing the high for the year in the S&P 500 in April. Kress writes, “From the present until the 2014 bottom, any market advances will depend on the quarterly/weekly cycles, and each subsequent year’s high and low should be below the previous year’s high and low.” He further believes that by the end of 2012/early 2013, a cascade-type decline similar to the 1973-74 and 2001-02 declines will punctuate the 2014 bottom of the 120-year Mega Cycle.
There is a final cycle component of the 120-year Mega Cycle which Mr. Kress has been wont to dismiss in recent years. I’m referring to the 4-year cycle, which answers to the Business Cycle (also known as the Presidential Cycle). It is the smallest complete cycle of the 120-year cycle series (the 2-year cycle is smaller but is technically a half cycle). The 4-year cycle is currently in the ascent and is scheduled to peak in late September 2012.
As we’ve discussed in recent reports, the 4-year cycle could hold the key to the upcoming year to a large extent. In my commentaries of the last few weeks I’ve emphasized that if the world’s central banks combined to produce a coordinate economic stimulus – a global QE3 if you will – then economic Armageddon could possibly be stalled until the 4-year cycle peaks next year. On Wednesday, Nov. 30, the S&P 500 (SPX) recorded its biggest gain since August after the Federal Reserve, the European Central Bank and other major central banks stepped in to head off escalating funding pressures that threaten the key arteries of the world's financial system. In addition to this, China acted to lower reserve requirements for its banking system.
Thus we have the beginning of what could be considered a coordinated monetary policy for re-liquifying the global economy. If the central banks rigorously stick to their promise, then the 4-year cycle should afford the financial system with perhaps one more year of survival until the final descent of the 120-year cycle series begins in late 2012/early 2013.
Gold
We got an immediate-term sell signal for gold earlier this month when the SPDR Gold Trust (GLD), our gold proxy, violated its 15-day moving average. GLD is trying to establish support back above the 15-day MA and is within reach of closing above its nearest pivotal high of 170.13 (the Nov. 30 close). Getting above this level should pave the way for the buyers to take the advantage in the immediate term. [Disclaimer: This commentary should not be construed as investment advice. Investors should follow their own opinion when participating in the market.]
Gold & Gold Stock Trading Simplified
With the long-term bull market in gold and mining stocks in full swing, there exist several fantastic opportunities for capturing profits and maximizing gains in the precious metals arena. Yet a common complaint is that small-to-medium sized traders have a hard time knowing when to buy and when to take profits. It doesn’t matter when so many pundits dispense conflicting advice in the financial media. This amounts to “analysis into paralysis” and results in the typical investor being unable to “pull the trigger” on a trade when the right time comes to buy.
Not surprisingly, many traders and investors are looking for a reliable and easy-to-follow system for participating in the precious metals bull market. They want a system that allows them to enter without guesswork and one that gets them out at the appropriate time and without any undue risks. They also want a system that automatically takes profits at precise points along the way while adjusting the stop loss continuously so as to lock in gains and minimize potential losses from whipsaws.
In my latest book, “Gold & Gold Stock Trading Simplified,” I remove the mystique behind gold and gold stock trading and reveal a completely simple and reliable system that allows the small-to-mid-size trader to profit from both up and down moves in the mining stock market. It’s the same system that I use each day in the Gold & Silver Stock Report – the same system which has consistently generated profits for my subscribers and has kept them on the correct side of the gold and mining stock market for years. You won’t find a more straight forward and easy-to-follow system that actually works than the one explained in “Gold & Gold Stock Trading Simplified.”
The technical trading system revealed in “Gold & Gold Stock Trading Simplified” by itself is worth its weight in gold. Additionally, the book reveals several useful indicators that will increase your chances of scoring big profits in the mining stock sector. You’ll learn when to use reliable leading indicators for predicting when the mining stocks are about o break out. After all, nothing beats being on the right side of a market move before the move gets underway.
The methods revealed in “Gold & Gold Stock Trading Simplified” are the product of several year’s worth of writing, research and real time market trading/testing. It also contains the benefit of my 14 years worth of experience as a professional in the precious metals and PM mining share sector. The trading techniques discussed in the book have been carefully calibrated to match today’s fast moving and volatile market environment. You won’t find a more timely and useful book than this for capturing profits in today’s gold and gold stock market.
The book is now available for sale at: http://www.clifdroke.com/books/trading_simplified.html
Order today to receive your autographed copy and a FREE 1-month trial subscription to the Gold & Silver Stock Report newsletter. Published twice each week, the newsletter uses the method described in this book for making profitable trades among the actively traded gold mining shares.
By Clif Droke
www.clifdroke.com
Clif Droke is the editor of the daily Gold & Silver Stock Report. Published daily since 2002, the report provides forecasts and analysis of the leading gold, silver, uranium and energy stocks from a short-term technical standpoint. He is also the author of numerous books, including 'How to Read Chart Patterns for Greater Profits.' For more information visit www.clifdroke.com
© 2005-2022 http://www.MarketOracle.co.uk - The Market Oracle is a FREE Daily Financial Markets Analysis & Forecasting online publication.