


Stock Market and AMEX Gold BUGS Contracting Fibonacci Spiral Implications
Stock-Markets / Financial Markets 2011 Dec 02, 2011 - 01:44 AM GMTBy: David_Petch

 Christmas is in the air, with festivities of Ramadan and the Festival of Lights all culturally intertwining to form a more current version of celebration, as all traditions of the past have formed. Here in Winnipeg, the housing prices finally appear to have topped out, with no visible cutbacks on spending. There is a lot of money in this city...but on the other side, there are those that are barely getting by. This is the most rapidly growing economic group by far. In the past, there was religious discrimination, racial discrimination, sexual orientation and now the latest, economic discrimination.
Under principles of democracy, the majority rule...however, in the case of economics, try pulling the loaf of bread out of an ultra wealthy individual's hand and things change quite dramatically. Economic rules quietly have been written for the rich and elite who have available loop holes to hide money. Income can be next to nothing, but they get their profits from dividends, share options, capital gains etc. Capital gains are taxed at a lower level in order to try and promote investment into the economy. This makes sense, but up here in Canada when our Progressive Conservative party seeks re-election, they will likely be booted out and replaced with the New Democrats.
Change is always good, but money can quickly dry up and raising taxes slows down economic growth even more. Factor in Peak Oil and an overall dramatic reduction in buying power due to transportation cost and this translates into people spending more time at home with family and one thing not discussed much...access to drugs. The coming change is going to be culture shock for most, especially since the nuclear family concept has literally blown up in North America. As I mentioned before, deep religious sects will thrive because of their values...let us hope that this is accomplished with peace and harmony...human kind never learns from history so do I really do not expect such a "lollipops and rainbows" scenario.
Aaron Russo had a movie released shortly near his death titled "From Freedom to Fascism". When the majority revolt against the rich because of monetary disparity, the military and police systems are designed to keep things peaceful. Tell me anytime a riot is done peacefully...emotions are bottled up and all it takes is one act of violence to spark a "mob mentality". We literally could see the US and Canada become somewhat Police states over the coming few decades if things are not handles properly.
That brings us to analysis of the HUI...one place where money is to be made in 2012. The Contracting Fibonacci Spiral the markets are trapped in spanned 34, 21, 13 and 8 years to a tee, each following the Golden Ratio to within 4% of time since 1932...so it would really be uncommon or run against the fabric of human nature and the Universe for this to be altered. I am going to start exploring the Contracting Fibonacci Spiral by looking at different transformations using square roots and in various other forms to see if this cycle runs in a transformed state.
AMEX Gold BUGS Index
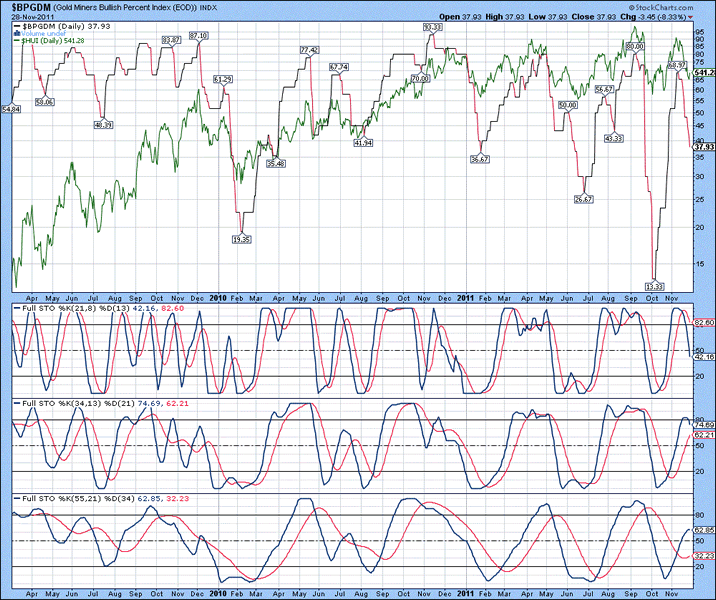
The daily chart of the Gold Miners Bullish Percentage Index (BPGDM) is shown below, with the HUI denoted in green. The ratio peaked in mid-November and since has declined to below 40, the range which often indicates a bottom. Full stochastics 1, 2 and 3 are shown below in order of descent, with the %K beneath the %D in 1 and above the %D in 2 and 3....notice the %K in stochastic 2 curling down though. Extrapolation of the %K trend in stochastics 1 and 2 suggest that another 7-10 trading days of sideways to downward price action should be expected.
Figure 1
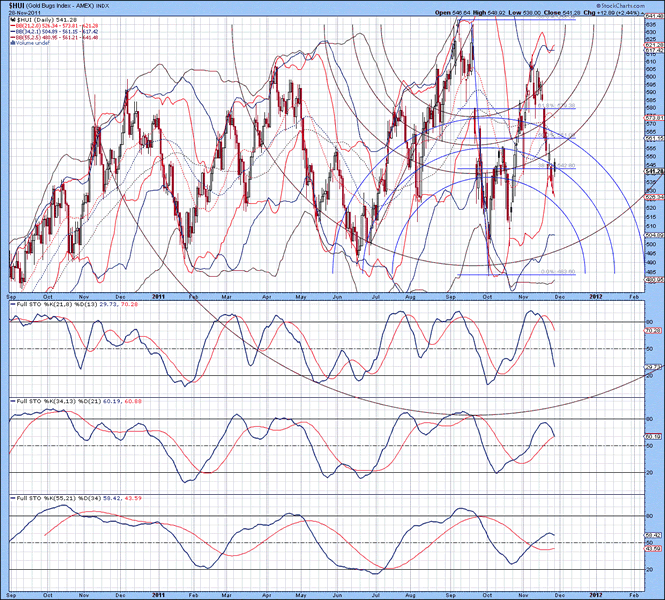
The daily chart of the HUI is shown below, with upper 34 MA Bollinger band still rising, suggestive that further sideways to downward price action is probable. The lower 21 MA Bollinger band has parted company from the recent decline, suggestive that a bottom may be either in the process of forming or that a mere pause is underway before declining lower. Full stochastics 1, 2 and 3 are shown below in order of descent, with the %K beneath the %D in 1 and 2 and above the %D in 3. Extrapolation of the %K trend in stochastics 1 and 2 suggest that weakness is likely to persist for at least another 7-10 trading days...a sharp reversal could occur at this point in time, but has a low probability of occurrence. It is starting to appear that weakness in the HUI will persist until mid-Decemberish before rising till early January and then having a final leg down into mid to late January 2012. Subsequently, the HUI should remain in a powerful uptrend for the remainder of 2012.
Figure 2
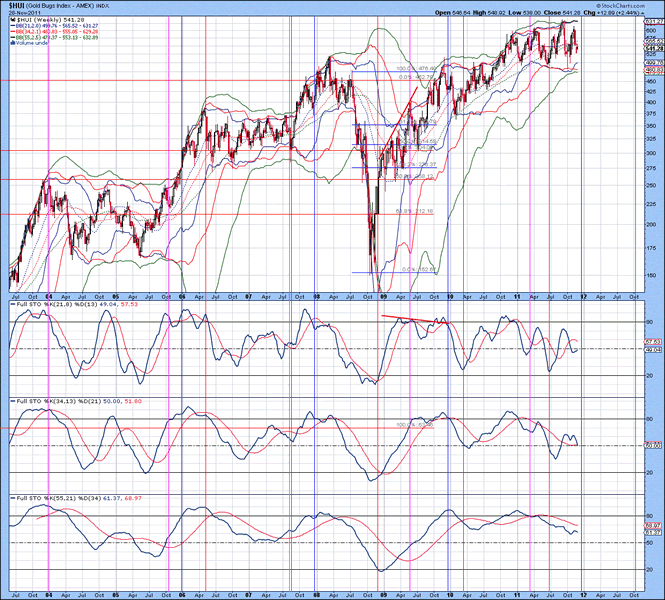
The weekly chart of the HUI is shown below, with all three upper Bollinger bands in close proximity to each other; lower Bollinger bands are not as tight as their upper counterparts, but nonetheless, are defining the sideways price action of the HUI over the course of the past 14 months...a breakout to the upside or downside is inevitable. Full stochastics 1, 2 and 3 are shown below in order of descent, with the %K beneath the %D in all three instances. Examination of stochastic 2 (lower low) to the HUI from early 2010 till the recent low and the HUI (higher low) formed a positive reversal, which has an upside objective target of 675. The time frame from 2006 till present has an inverted head and shoulders pattern, which has an upside price objective of 1000-1050. Stretching into the field of technical analysis has nothing but upside price objectives for the HUI at present. Based upon positioning of the %K in stochastics 1 and 2, do not expect to see the HUI rally anytime before early to mid-January 2012.
Figure 3
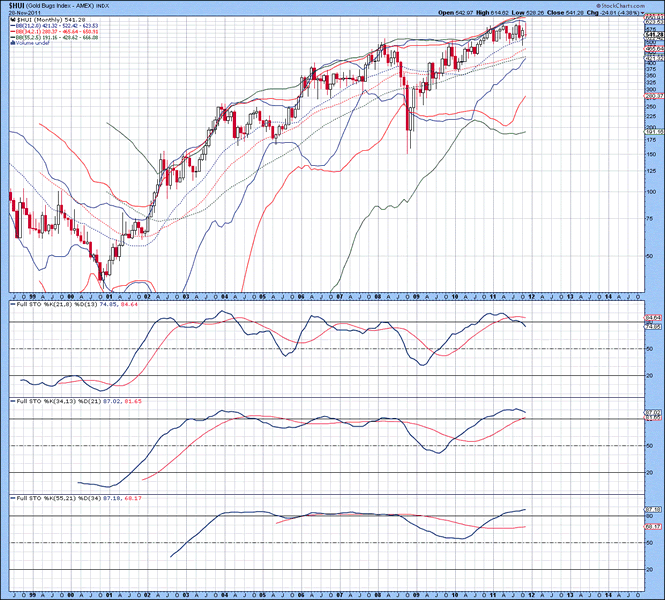
The monthly chart of the Hui is shown below, with all three upper Bollinger bands above the HUI. The lower 21 and 34 MA Bollinger bands continue to ascend and if things go as expected, the lower 21 MA Bollinger band is set to approach the index price sometime near February 2012, which would see it curl over. Full stochastics 1, 2 and 3 are shown below in order of descent, with the %K beneath the %D in 1 and above %D in 2 and 3. The bull market in the HUI has been underway for some 10 plus years so stochastics are rather stretched at the moment. Examination of the %K in stochastic 3 relative to the %D suggests that there is no chance of a top for at least 12 months out.
Figure 4
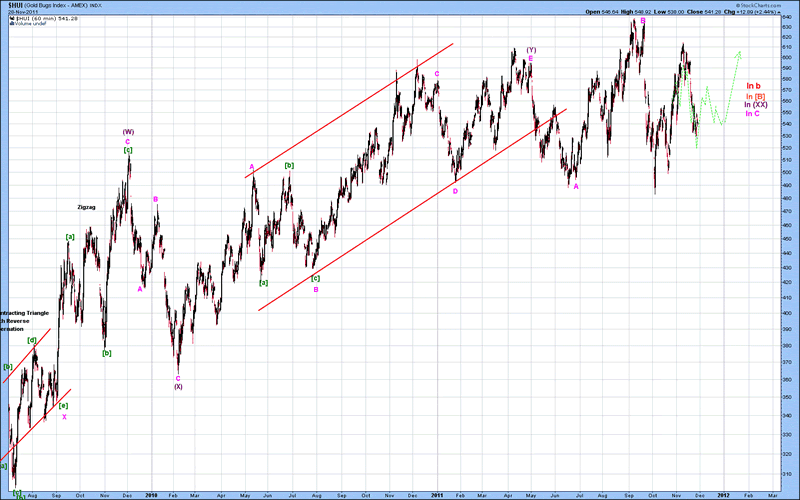
The mid-term Elliott Wave count of the HUI is shown below, with the thought pattern forming denoted in green. At present, wave [c].C is either complete or still has further sideways price action. Wave C is taking form of a terminal impulse (triangle) within a flat structure. I have the sideways action of the HUI ending at the end of December, but it easily could go sideways into mid to late January 2012 before breaking out...this would see wave (XX) complete, with wave (Z) set to ascend for at least 10-12 months. The HUI is sitting within quadruple top formation...every time another top and bottom are added to this sort of sideways price action the power of the breakout and upside price objective increases.
Figure 5
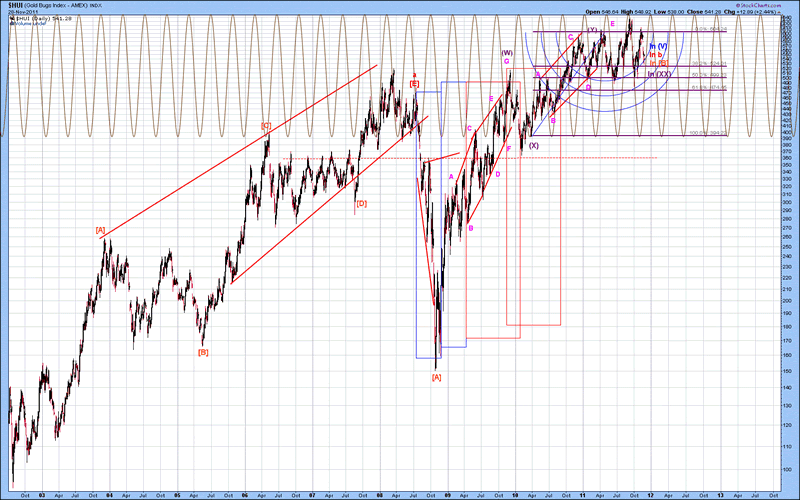
The long-term Elliott Wave count of the HUI is shown below, with wave (XX) thought to be forming at present. I should note that wave f can also be labelled as w, wave [A] as x and wave y underway at present. Under either scenario, there is an important top due in late 2012/early 2013 that will see overlap with wave [A].g...likely near the top of the range, but still, this implies at least a 50% correction if the HUI makes it to the 1000-1050 area as expected.
Figure 6
S&P 500 Index
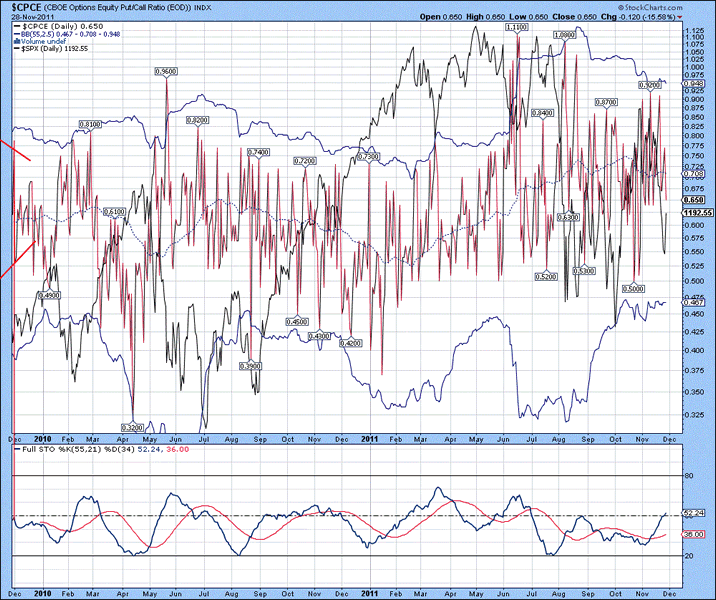
The daily chart of the CBOE Options Equity Put/Call Ratio Index is shown below, with the S&P 500 Index denoted in black. At present, the ratio has been in a range between 0.6 and 0.9, indicating a floor is in place for the markets...a decline to 0.5 or lower would be an indication of a top. For this chart and this chart only, the %K above the %D is a sign of strength in the stock market and a move beneath is a sign of weakness. At present, the %K is above the %D, indicating general weakness in the broad stock market indices.
Figure 7
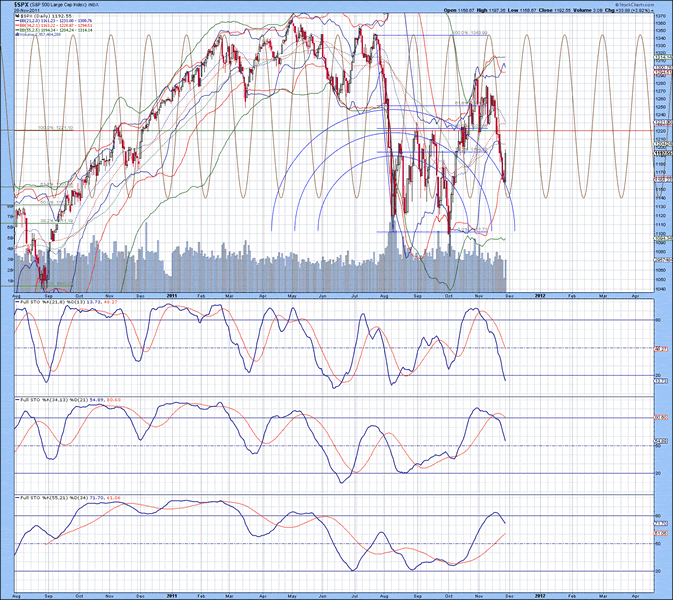
The daily chart of the S&P 500 Index is shown below, with upper Bollinger bands well above the index, while all three lower Bollinger bands are beneath the index, suggestive that a bottom of some Degree was put in place. The upper 21 MA Bollinger band recently curled down, suggestive that a bottom was put in place. Upper 34 and 55 MA Bollinger bands are still well above the index and will require at least 4-6 weeks of time before there is a contraction in volatility as noted by upper and lower Bollinger bands approaching each other. Full stochastics 1, 2 and 3 are shown below in order of descent, with the %K beneath the %D in 1 and 2 and above the %D in 3 (note how it is rolling over though). Extrapolation of the %K trend in stochastics 1 and 2 suggest at least 4-6 weeks of time before a bottom is put in place. So again, everything is pointing towards a bottom no earlier than the end of December (Orthodox low (higher low)) and no later than mid-February...it all depends how everything pans out.
Figure 8
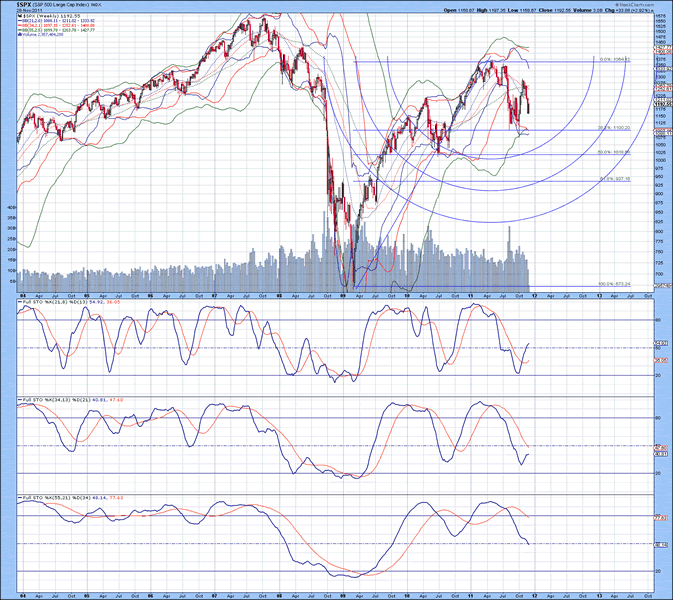
The weekly chart of the S&P 500 Index is shown below, with upper 34 and 55 MA Bollinger bands above the index, while all there lower Bollinger bands are in close proximity to each other beneath the index. What makes this setup different from the 2008 decline when Bollinger bands were in a similar setup?...Lower 21 and 34 MA Bollinger bands are near the lower end of their range, instead of being near the upper portion. Full stochastics 1, 2 and 3 are shown below in order of descent, with the %K above the %D in 1 and beneath the %D in 2 and 3. When the %K in stochastic 2 crosses above the %D in 3, it will generate a buy signal on the weekly chart...this is not likely to occur before mid to late January.
Figure 9
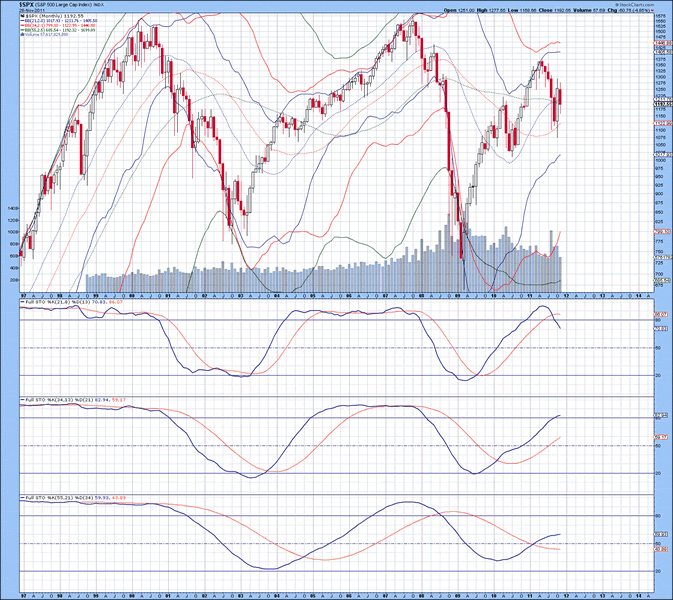
The monthly chart of the S&P 500 Index is shown below, with lower 34 and MA Bollinger bands in close proximity to the 55 MA Bollinger band, unlike years 2000 and 2008...this suggests that a top is not likely to be put in place until later in 2012/early 2013. Full stochastics 1, 2 and 3 are shown below in order of descent, with the %K beneath the %D in 1 and above the %D in 2 and 3. Extrapolation of the %K trend in stochastic 2 suggests that a top is not likely to be put in place until late 2012/early 2013.
Figure 10
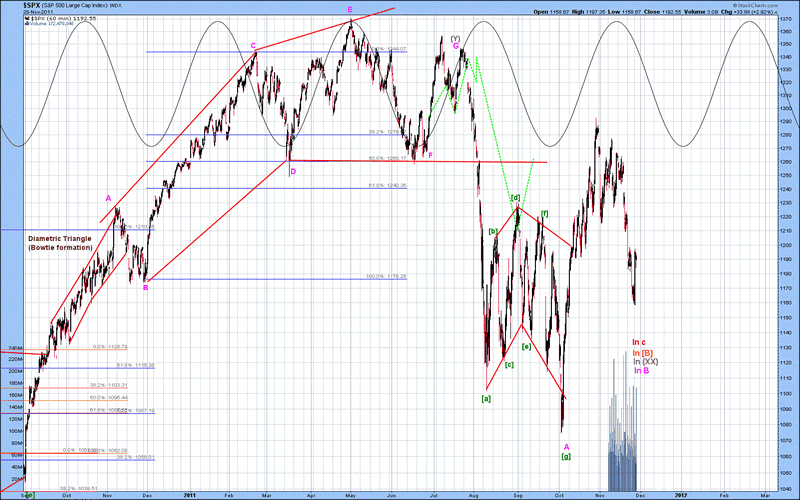
The mid-term Elliott Wave count of the S&P 500 Index is shown below, with wave B either complete or still forming. It is also possible to label this pattern with wave A.(XX) as W.(XX), wave X.(XX) topping out in mid November, with wave Y.(XX) forming. I know the rules that wave B is supposed to take an equivalent or longer period of time than wave B, which is why I have wave B still listed as underway at present. The count shown below, would have wave B complete no earlier than mid-December, with wave C.(XX) to follow. This would take the S&P into late January/early February before bottoming. One hunch is that the HUI will start advancing in advance of the broad stock market indices, so watch carefully how this unfolds. Once wave (XX) completes, then wave (Z) should carry the S&P 500 Index up to at least the 1500-1550 level, potentially even to 1600-1650 in late 2012/early 2013...all based on the US Dollar Index set to decline for most of 2012 and into early 2013. Once a top is put in place for the broad stock market indices, the correction from 2013 into early/mid 2014 will be brutal, with a MINIMUM of a 40-50% correction. The Contracting Fibonacci Spiral the markets are trapped in at the moment has had every signature date have at least a 40-50% correction...the length of corrections that follow are not determined by this Cycle (note the 1987 correction and how rapidly things picked up after that) so it is not something to bet against.
Figure 11
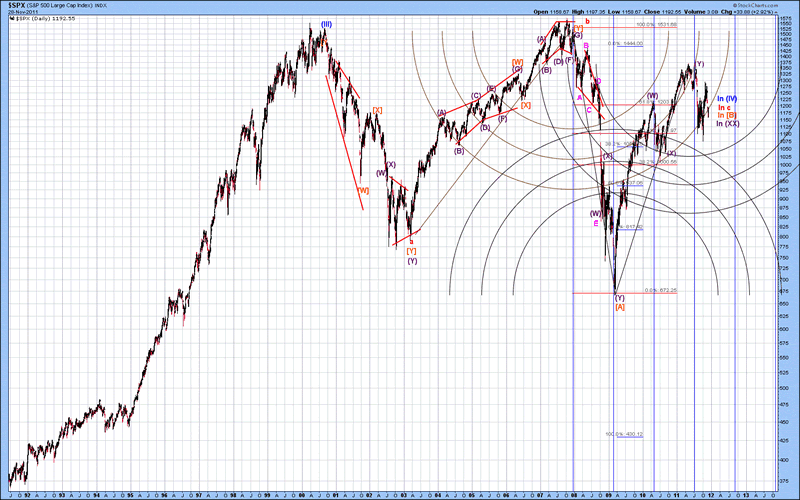
The long-term Elliott Wave count of the S&P 500 Index is shown below, with wave (XX).[B]c thought to be forming at present. Once complete, wave (Z).[B] should rise to take the S&P at least to the former highs of 2000 and 2008, likely higher before topping out. Once complete, wave [C].c should see a 50% retracement of the top value...in other words, a top of 1700 would see a low near 800-850 at some point in late 2013/early 2014.
Figure 12
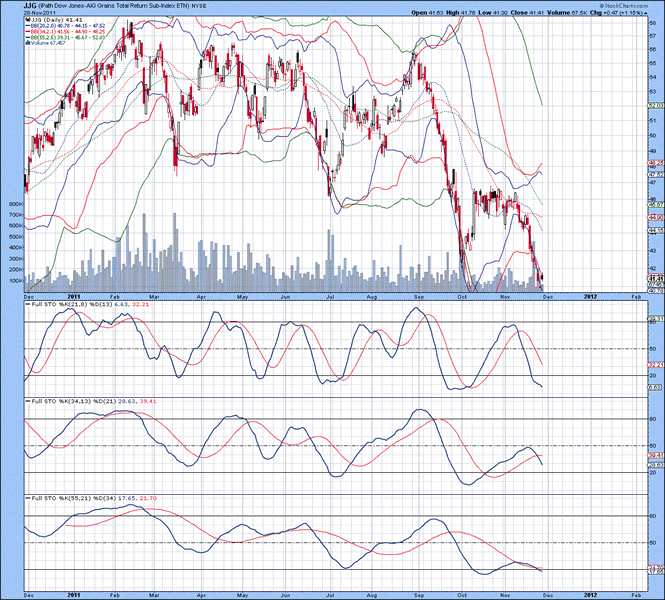
Well, that is all for today...hopefully this helps to paint a picture of where things are going. Yesterday a subscriber asked me to look at JJG, or Dow Jones Grains Total Return Sub Index, so the daily chart is presented below. The upper 21 MA Bollinger band just curled down, suggestive that a bottom of some Degree was put in place, but not yet complete. When the upper 34 MA Bollinger band (red) curls down, it will indicate a bottom and the pattern is complete. The index had price action outside the lower 34 MA Bollinger band (red), indicating an oversold condition is developing...this is also supported by the lower 21 MA Bollinger band falling beneath the 34 MA Bollinger band. Full stochastics 1, 2 and 3 are shown below in order of descent, with the %K beneath the %D in all three instances. Extrapolation of the %K trend in stochastics 1 and 2 suggest that a true bottom will not be put in place until at least the 2nd or 3rd week of December. Note that the lows may have been put in place, but sideways price action should persist until at least mid-December, potentially until near the end of the month.
Figure 13
Okay...this was a rather HUGE update, so have a good one and back tomorrow with an update of the US Dollar Index.
By David Petch
http://www.treasurechests.info
I generally try to write at least one editorial per week, although typically not as long as this one. At www.treasurechests.info , once per week (with updates if required), I track the Amex Gold BUGS Index, AMEX Oil Index, US Dollar Index, 10 Year US Treasury Index and the S&P 500 Index using various forms of technical analysis, including Elliott Wave. Captain Hook the site proprietor writes 2-3 articles per week on the “big picture” by tying in recent market action with numerous index ratios, money supply, COT positions etc. We also cover some 60 plus stocks in the precious metals, energy and base metals categories (with a focus on stocks around our provinces).
With the above being just one example of how we go about identifying value for investors, if this is the kind of analysis you are looking for we invite you to visit our site and discover more about how our service can further aid in achieving your financial goals. In this regard, whether it's top down macro-analysis designed to assist in opinion shaping and investment policy, or analysis on specific opportunities in the precious metals and energy sectors believed to possess exceptional value, like mindedly at Treasure Chests we in turn strive to provide the best value possible. So again, pay us a visit and discover why a small investment on your part could pay you handsome rewards in the not too distant future.
And of course if you have any questions, comments, or criticisms regarding the above, please feel free to drop us a line . We very much enjoy hearing from you on these items.
Disclaimer: The above is a matter of opinion and is not intended as investment advice. Information and analysis above are derived from sources and utilizing methods believed reliable, but we cannot accept responsibility for any trading losses you may incur as a result of this analysis. Comments within the text should not be construed as specific recommendations to buy or sell securities. Individuals should consult with their broker and personal financial advisors before engaging in any trading activities as we are not registered brokers or advisors. Certain statements included herein may constitute "forward-looking statements" with the meaning of certain securities legislative measures. Such forward-looking statements involve known and unknown risks, uncertainties and other factors that may cause the actual results, performance or achievements of the above mentioned companies, and / or industry results, to be materially different from any future results, performance or achievements expressed or implied by such forward-looking statements. Do your own due diligence.
Copyright © 2011 treasurechests.info Inc. All rights reserved.
Unless otherwise indicated, all materials on these pages are copyrighted by treasurechests.info Inc. No part of these pages, either text or image may be used for any purpose other than personal use. Therefore, reproduction, modification, storage in a retrieval system or retransmission, in any form or by any means, electronic, mechanical or otherwise, for reasons other than personal use, is strictly prohibited without prior written permission.
David Petch Archive |
© 2005-2022 http://www.MarketOracle.co.uk - The Market Oracle is a FREE Daily Financial Markets Analysis & Forecasting online publication.