


Uranium Stocks - This is Still a Gamblers Market
Commodities / Uranium Dec 24, 2007 - 02:18 AM GMTBy: Merv_Burak

 It's been a great week for some uranium stocks and still a bummer for others. The Merv's Weekly Uranium Index closed the week at 9398.03, up 582.27 points or 6.60%. Of the 50 component stocks, 29 were winners while 20 were losers. There was one stock unchanged on the week. As for the five largest stocks, they were mixed. Cameco gained 7.4%, Denison gained 0.5%, Paladin lost 5.2%, UEX lost 7.7% and Uranium One gained 4.3%. The best weekly performer was Alberta Star with a gain of 84.0% while the worst performer was Triex Minerals with a loss of 14.3%.
With the weekly gain the charts and indicators improved BUT still not enough to turn the ratings into bullish ones. On the long term the Index is still below its negatively sloping moving average line. The momentum indicator is still in its negative zone. Looking at the weekly table and the summation of individual stock long term ratings, they are still on the bearish side with only 14% bullish and 69% bearish. Nothing here has yet suggested a reversal of long term trend. The long term rating remains BEARISH .
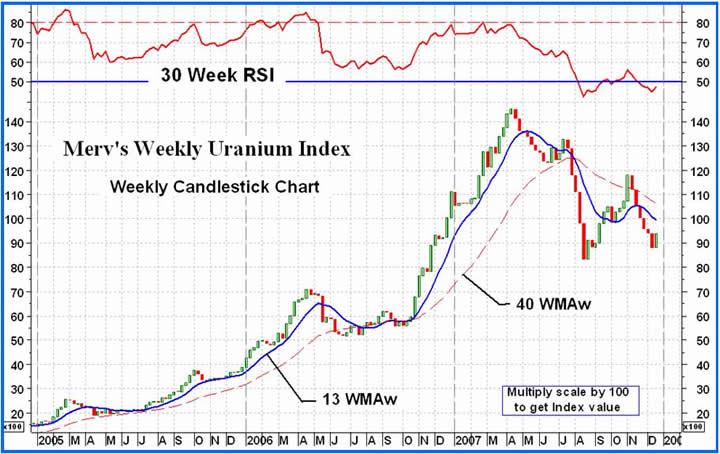
On the intermediate term, looking at both the weekly and daily Indices, and appropriate indicators, nothing much has changed here either. Both Indices are below their intermediate term moving average lines and the lines continue to point downward. The momentum indicators are still in their negative zones although the daily Index indicator has turned and started to move higher. As for the volume indicator, the daily Index gives us an indicator that has turned upward but is still below its intermediate term trigger line for a still negative reading. Looking at the weekly table and the summation of individual stock ratings, it is still on the bearish side with only 20% bullish and 72% bearish. Here too, one must remain with the – NEUTRAL rating of Thursday, until the indicators perk up a little bit more.
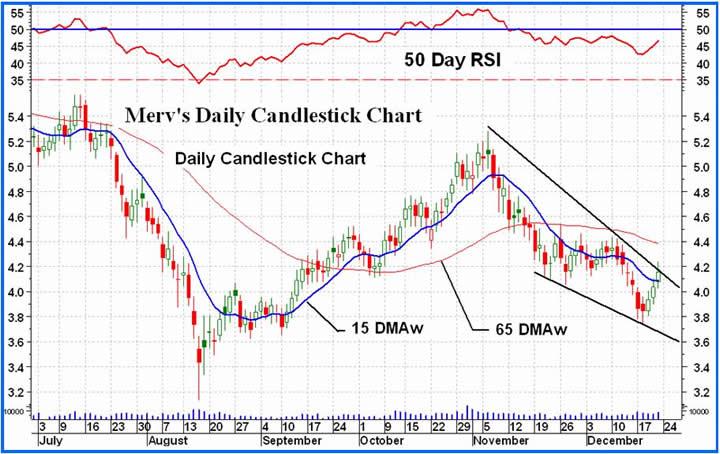
On the short term, we go to the daily Index. Here, things are getting a lot brighter but not yet rosy. After three days of upside markets the Daily Index is above its short term moving average line and the line has turned but not yet to the up side. It is at a horizontal slope waiting for one more up day to turn positive. As for the momentum, it has turned up and heading towards its neutral line but is still in its negative zone. An interesting pattern was shown yesterday. That is a downward sloping wedge pattern. These patterns are usually bullish patterns suggesting an eventual upside break and a reversal of trend, or at the least a good rally. Friday's action penetrated the upper resistance line of the wedge but the Index was unable to close above the line. It should make a decisive upside break on Monday but with holiday action maybe one should wait till Wednesday for confirmation. A downward move would not be encouraging. Again, looking at the information in the weekly table we see that the majority of component stocks are still in short term bearish territory. We have an overall summation of individual stock ratings at a bullish 36& and a bearish 55%. The NEUTRAL short term rating of Thursday remains for another day.
What does all this mean? Well it is not yet the time to be getting all bullish on the uranium stocks. They just MIGHT be starting a new bull move but I am more inclined to lower my risk of capital loss and wait for the charts and indicators to tell me the reversal has occurred. There will be plenty of time and opportunity to profit after. Yes, you will miss some gains but that's what happens when one tries to reduce the risk. This is still a GAMBLER'S market.
By Merv Burak, CMT
Hudson Aero/Systems Inc.
Technical Information Group
for Technically Uranium with Merv
Web: http://techuranium.blogspot.com/
e-mail: merv@themarkettraders.com
During the day Merv practices his engineering profession as a Consulting Aerospace Engineer. Once the sun goes down and night descends upon the earth Merv dons his other hat as a Chartered Market Technician ( CMT ) and tries to decipher what's going on in the securities markets. As an underground surveyor in the gold mines of Canada 's Northwest Territories in his youth, Merv has a soft spot for the gold industry and has developed several Gold Indices reflecting different aspects of the industry. As a basically lazy individual Merv's driving focus is to KEEP IT SIMPLE .
This Blog is - A periodic review of the daily or weekly market action in uranium stocks. The review is strictly from the technical perspective. Merv is a pure market technician. Weekly, one will find a table of technical information and ratings of the 50 component stocks of the Merv's Uranium Index as well as a weekly summary of the uranium stock activity. Daily (most days), one will find a daily review of the market action of the Merv's Daily Uranium Index as well as technical analysis of one or more uranium stocks of interest.
Disclaimer - Technical analysis is not perfect. Should you expect perfection this is not the site for you.
Technical analysis IS a very sound technique to assess the daily or weekly trading activities in securities and to assess appropriate timing of investment activities. This blog provides such technical analysis of the trading activity in uranium stocks for your information. Any use made of this information is strictly at the users risk. No guarantees are made for the accuracy or potential for the information provided herein. Use at your own risk. You are strongly advised to check with your broker or investment adviser before activating any investment desisions.
Merv Burak Archive |
© 2005-2022 http://www.MarketOracle.co.uk - The Market Oracle is a FREE Daily Financial Markets Analysis & Forecasting online publication.