


Will the Efficient market Hypothesis and Random Walk Theory still valid in Today's Market
InvestorEducation / Learn to Trade Dec 01, 2011 - 03:41 PM GMTBy: Sam_Chee_Kong

 Efficient market Hypothesis refers to the condition whereby the current prices of the securities have already incorporated any news that arises from those securities without delay. In other words, the pricing of any security will be so efficient that there will not be any opportunity to arbitrage the price differential before and after the news is released.
Thus, even with the use of technical analysis using indicators and oscillators to TIME the market and fundamental analysis using company financial information and earnings to select undervalue stocks, the investor will still not be able to reap better than average returns on the market.
So, under normal conditions the current price of any securities represents the best unbiased estimate value of the particular investment and any old information cannot be used to predict future price movement. In other words the Efficient Market Hypothesis has some relevance to the Random Walk Theory when it comes to predict future price movement of any security.
The Random Walk Theory can be defined as the past movement or trend of a stock price cannot be used to predict future prices. According to the theory, stock prices movements are at best unpredictable and investors cannot consistently outperform the market. In other words, it is impossible to know whether the next move in the price will be up or down or by how much it will rise or fall.
It is best describe with the following chart.

Weak, semi strong and strong EMH
The Efficient Market Hypothesis, was first brought to the limelight in 1965 by Eugene Fama in his PHD thesis. According to him, the Efficient Market Hypothesis takes three forms which are weak, semi-strong and strong.
The weak form of EMH stipulates that the current price of the securities have already reflected any news that is available either on the company’s website, financial publication, newspaper, magazine and etc. This is because nobody will have any advantage over others in trading the markets by using this information because it has already been most publicly available and easily accessible.
The semi-strong form indicates that someone even with the knowledge the company’s financial statements, announcement and other information related to the company will not be able to predict the future price movement and hence garner higher returns due to the speed the information incorporates into its price..
The strong form of EMH, states that even those armed with insider information will not be able to beat the speed in which the information is reflected into the price. In other words it also meant that company directors and managers are not able to take advantage given their knowledge in insider information to make gains in the movement of its shares prices.
Before we try to debunk the above hypothesis, we need to understand the inner workings of the financial markets first. We need to understand the forces that causes the price of stocks to rise and fall by the minutes, hours and days.
Supply and Demand influence Stock Prices
To begin with, we need to know how the market sets the stock prices? Stock prices are driven by the demand and supply factors initiated by a large amount of willing buyers and willing sellers. The buying and selling of a particular stock or through the price discovery mechanism, will eventually settles on a price equilibrium as shown in the figure below.
To illustrate the different forms of EMH, scenario 1, John is considering buying a stock that is going to declare a dividend of $3 per share in the next few months. But Market analysts only project a growth of 4% for the company’s dividend in the next year. The current term deposit rates pays 8%. So in order to compensate John for the risk taken to purchase such a low growth stock, John need to have a higher rate of return than what offered by the term deposit which is 8%. Say John decided to settle for a rate of return of 15% based on the risk involved in investing in a low growth company. This is the weak form of the EMH because the information is publicly available. .
Scenario 2, another investor Sam, has a different view on the market. He is confident that the dividend pay by the company in the following year will grow to 5% because he got insider information from the management of the company. Hence, he only requires a 14% return on his investment due to the lower risk perceived. This represents the semi-strong form of the EMH because Sam has the information about the company through some insiders.
Scenario 3, Andrew who is the Director of the company, obviously know much more than everybody else about the company.. He knows that the next year’s expected dividend payout is going to be 5% and also the financial health of the company. He knows not only when the next dividend will be paid but also how much. Armed with this information he does not mind having a lower return on his investment and in this case say 12%. Andrew’s case represents the strong form of the EMH.
So, based on the above information, how can we arrive to a price where it is considered optimum to John, Sam and Andrew?
According to the Gordon Growth Model, the price of a security can be calculated based on the assumption of constant dividend growth. That is why most firms strive to increase their dividends at a constant rate every year. The formula for the calculation is as follows:
P = D/(K-G)*100 where,
P = price
D = recent dividend paid
K = the required return on a particular investment (stock in this case)
G = expected growth rate of the dividend
So based on the available information, the price John willing to pay is :
P = 3/(15-4)*100 = $ 27.27
Sam is willing to pay,
P = 3/(14-5)*100 = $ 33.33
And Andrew willing to pay.
P = 3/(12-5)*100 = $ 42.85
The Theory of Rational Expectation
In other words, the above case demonstrates how the market sets the price of the stock through different forms of strength in the EMH. It also tells us that people’s perception on the stock price evaluation is based on what they call ‘The Theory of Rational Expectation’.
Andrew is willing to pay more for the stock price because he expects this particular investment to be of lower risk, whereas John is willing to pay less for the stock price because he expects this investment to be more risky. This is because the market analysts only project a 1% increase in the dividend payout and also he does not have any information about the financial health of the company.
Technical Analysis in predicting stock movements
Accordingly, empirical evidence through history prove that stock price movement are predictable and non Random. In his book, a Non Random Walk Down Wall Street, Lo and MacKinlay, demonstrated that by using powerful computers and advance econometric modeling, the movement of stock prices indeed followed a non random pattern and can be predicted.
In the publication of the Journal of Finance in 2000, Andrew Lo wrote an article titled : Foundations of technical Analysis, Computational Algorithms, Statistical Inference and Empirical Implementation. In his opening remark, it says :
"Technical analysis, also known as charting, has been part of financial practice for many decades, but this discipline has not received the same level of academic scrutiny and acceptance as more traditional approaches such as fundamental analysis. One of the main obstacles is the highly subjective nature of technical analysis. The presence of geometric shapes in historical price charts is often in the eyes of the beholder. In this paper, we propose a systematic and automatic approach to technical pattern recognition using nonparametric kernel regression, and apply this method to a large number of U.S. stocks from 1962 to 1996 to evaluate the effectiveness of technical analysis. By comparing the unconditional empirical distribution of daily stock returns to the conditional distribution conditioned on specific technical indicators, such as head-and-shoulders or double-bottoms, we find that over the 31-year sample period, several technical indicators do provide incremental information and may have some practical value." This paper can be found at www.nber.org
The origin of technical analysis can be trace back to the Dow Theory which dates back more than 100 years.The Dow Theory, is also proof that systems can outperform the market and reduces risk. The Dow theory states that the market is in an uptrend if any of the Dow Transports and Dow Industrials averages advances above the previous high and vice versa.
Stephen Brown of New York University and William Goetzmann of Yale University in their publication in the Journal Of Finance, demonstrated that when the Dow Theory tested using data from 1929 to 1998 manage to outperform the buy and hold approach by about 2% per year. It also proved that the portfolio carried significantly much less risk.
High Frequency Trading or HFT
The use of High Frequency Trading also proofed that investors are able to make better than normal returns regardless of how efficient the markets incorporates information into its prices. High frequency trading is essentially refers to large and very fast execution of quote orders by computers programs which will create cascade like buying and selling.
Trading cycles what seems to be days and weeks now are being done in milliseconds and nanoseconds. In other words market has shifted from the traditional (fundamental and technical analysis) with long term holding for equity appreciation to short term trading that benefit only the speculators. The strategy of investing today refers to ‘here and now’ rather than ‘buy and hold’
The reason for the competition to ‘race to zero’, is because it enable them to ‘front run’ their competitors. By front running it means it effectively put them at the front of the queue and have priority over other orders and help them react faster than others. According to some people in the know, Citadel which is one of the HFT heavyweights receives order flow from brokers like TOS. When they receive orders, they can decide whether or not to fill your order according to your price. If they fill you up then they will know exactly what are the small players buying, their market sentiment and momentum. By totaling the retail orders they are able to judge market sentiment on a particular price and also the pain threshold of the weak holders.
Predatory HFT programs are design to block retail investors from making successful trades against the house or Wall Street. An example in the following shows how the game of front running being played. Say stock ABC is being traded at the bid of $1.00 and ask $ 1.02. As a retail investor key in an order to buy at $1.02, normally it will get filled. But HFT programs which is ‘able to see’, will automatically raise the ask price to $ 1.03. So the next bid price will be higher and automatically set as $1.01, so that the HFT programs make the human investor to buy higher at $ 1.03 instead of $ 1.02. .
According to Themis Trading Analysis white paper the profits generated by HFT and Algorithmic (algos) trading can go as high as $ 3 billion a year even though margins generated from each trade ranges from $0.01 - $ 0.02. Although they are not making much money from such spreads but they are making a killing from liquidity or Volume rebates of 0.005/share from the exchange. It is reported that Goldman Sach’s HFT trading alone revved up something like 2 billion shares a week and you times that with $0.005/share and times again 52 for the rest of the year and the figure surely adds up!!
In short, HFT trading is just basically latency arbitrage and those with ultra high speed computer hardware will always stays on top. And with its predatory HFT programs which is design to trigger cascade like buying and selling and also front running the chances of them losing in the market is minimal
Algorithmic Trading or Robo Trading
Algorithmic Trading is another form of trading whereby investors use pre programmed trading software to execute instruction given to it. A good example will be the use of algorithmic trading to look out for arbitrage opportunity that exists in inter market price differentials. This is especially true if the security is Dual Listed or Multiple Listed on different markets.
In financial lingo, arbitrage refers to the practice of taking advantage of the price differential of the securities traded in two or more markets.
If the market is so efficient that there wouldn’t be any differential in pricing that can be taken advantage by stock arbitraging. So in essence, we can conclude that the Efficient Market Hypothesis and Random Walk Theory will not be applicable in today’s financial markets.
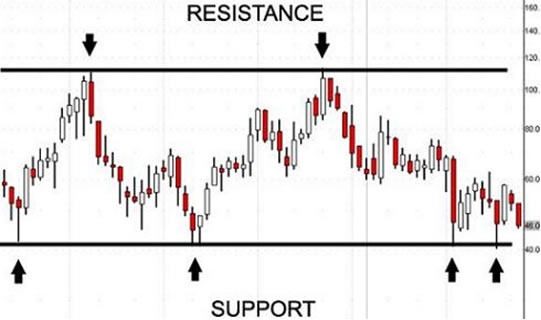
The gyration of prices on the Daily, Weekly and Monthly charts represents the “tide of speculation”. It is caused by the combination of fear and greed of investors. It is this “tide of speculation” that produced what we call the ripples and waves in the financial markets.
To illustrate how we can take advantage from the ‘tide of speculation’ take a look at the simple bar chart below. An investor who ‘trade the market’ will be able to do much better than a buy and hold investor. If he just time the market and buy when the stock rebounded from the support level and sell when it reaches the resistance level, he will have multiple trading opportunities to make money.
However, since the days of Eugene Fama, there has been a tremendous leap in the advancement of technologies, techniques in studying the market, new studies in ‘behavioral finance’ and etc, enables the investor to somewhat predict the future movement of stock price patterns.
In others words an investor will be able to reap in better than average returns in the stock markets if he employs the right technical, fundamental and crystal clear and disciplined mindset, when investing in the stock markets. This is why companies like Apple and Google, attract most institutional investors because they know that there will be continuous income flow from these companies and hence future dividends.
To summarize, it is now possible to predict the movement of multiple-asset class trading in multiple markets with the availability of modern charting tools and information technologies. It is possible to constantly beat the market for higher than normal returns provided you possess the right tools and mindset so that you don’t show up in a fight with just a blunt knife.
The journey to financial freedom through financial markets is not easy and this profession is one of the toughest in the world. In fact it is tougher than rocket science. If it is so simple then there wouldn’t be any lower and middle income group. All of us will be in the high flying upper income echelon of society. Just punch a few buttons and click ‘Buy’ or ‘Sell’ and voila off we go to the golf course for a round or two? Don’t dream !!
Even Isaac Newton is not spared, who lost an equivalent of $2.7 million in today’s money due to his speculation during the South Sea Bubble in the 1720s. As Isaac Newton put it bluntly :
“ I can calculate the motions of heavenly bodies, but not the madness of people”
Sir Isaac Newton
by Sam Chee Kong
cheekongsam@yahoo.com
Investment Banking with experience in Capital Raising, Hedging and Risk Management.
B.Econs, Flinders University, Adelaide, South Australia
Post Graduate Diploma in Treasury Management, Treasury Management School of New Zealand
Specialize in Derivatives like debt/equity swaps, bonds, options, forwards contracts, interest rate swaps
© 2011 Copyright Sam Chee Kong - All Rights Reserved
Disclaimer: The above is a matter of opinion provided for general information purposes only and is not intended as investment advice. Information and analysis above are derived from sources and utilising methods believed to be reliable, but we cannot accept responsibility for any losses you may incur as a result of this analysis. Individuals should consult with their personal financial advisors.
© 2005-2022 http://www.MarketOracle.co.uk - The Market Oracle is a FREE Daily Financial Markets Analysis & Forecasting online publication.