Stocks Bear Market Seasonals
Stock-Markets / Stocks Bear Market Nov 25, 2011 - 01:57 PM GMTBy: Zeal_LLC
 The general stock markets’ day-to-day price action utterly dominates individual stock sectors, including commodities stocks. So anything traders can do to better understand the forces driving the stock markets as a whole leads to better stock entries and exits universally. With this truth in mind, many speculators and investors wonder whether commodities-like seasonality also exists in the general stock markets.
I’ve certainly pondered this question myself over the years, and I’m not alone. Inevitably whenever I write an essay on commodities seasonality, traders write in asking about general-stock seasonality. And after advancing our gold and gold-stock seasonality research in the last couple weeks, I’ve seen plenty of new inquiries. So in light of the ongoing demand for answers, I figured I’d see what tales the data has to tell.
But a big caveat is in order up front. There is a major reason why I haven’t done any research work on general-stock seasonality over the past decade. Since early 2000, the stock markets have been mired in a mighty secular bear. The price behavior in such a beast is wildly different in character from the parallel secular bulls in commodities. While secular bulls lend themselves to seasonality studies, secular stock bears simply don’t.
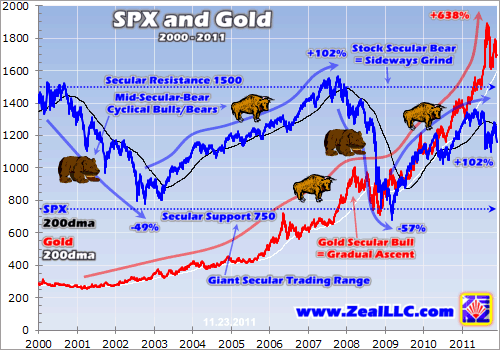
And this chart shows why. The US stock markets as represented by their flagship S&P 500 stock index (SPX) are rendered on top of the gold price over this past decade or so. While gold has been rising on balance over this entire span, making it very suitable for seasonality analysis, the stock markets haven’t been similarly falling. Despite popular misconceptions, a secular stock bear is really a long sideways grind.

Gold has soared 638% at best since its bull’s humble beginnings in early 2001. Amazingly, it has never had a down calendar year throughout this entire secular bull! With annual gains ranging from 5% to 31%, this metal’s upward ascent has been remarkably consistent. Sure, gold still experiences healthy bull-market corrections from time to time just like any other bull. But it gradually ascends on balance, making it perfect for seasonality studies.
Now if a secular stock bear gradually declined over much of its entire span, it would probably exhibit marked seasonality. But that’s not how secular stock bears behave. They are really a gigantic sideways grind, a series of smaller cyclical bears and cyclical bulls parading through with no net gains. The cyclical bears tend to cut stock prices in half, then the cyclical bulls subsequently double them again (taking the SPX right back to its starting point). The end result is a massive consolidation.
These secular stock bears tend to last for 17 years, half the duration of a Long Valuation Wave. They happen because stocks get wildly overvalued at the end of the preceding 17-year secular bull, they are bid up to ridiculously-high prices relative to their underlying corporate earnings. After being so rampantly overvalued, stock prices then grind sideways for the better part of two decades until earnings have had enough time to grow into the high stock prices.
This gradually drives valuations down, and once they are low enough the secular bear gives up its ghost. Then the next Long Valuation Wave can begin, a complete secular-bull-secular-bear cycle that tends to run a third of a century. Seasonality doesn’t work so well in secular stock bears’ long sideways grinds because the net result is flat stock prices. Today the SPX isn’t much lower than it was in late 2000.
The mid-secular-bear cyclical bears that cut the SPX in half, and the subsequent mid-secular-bear cyclical bulls that doubled it, largely kept this flagship index trapped between 750 and 1500. The overarching trend isn’t down, it’s just flat. And naturally seasonals mirror their underlying data’s secular trend. In bull markets they tend to rise throughout a calendar year, and in flatlined markets they tend to reflect this lack of progress.
This is why I haven’t done stock-bear-seasonality research to this point. Sure, I’m interested too. But seasonals in a flat market almost have to be flat too, which would likely limit their utility to traders. And I suspected that the parade of large cyclical bears and cyclical bulls we’ve seen since 2000 would largely cancel each other out. But you never know for sure until you run the numbers, so I gave it a shot.
To keep all our seasonality research comparable, I used the same methodology described in my gold work. Every calendar year is individually indexed, which ensures percentage changes are perfectly comparable despite changing baseline SPX levels. A 30-point daily SPX rally off of 1500 is much less impressive than those same 30 points around 750. It’s percentages we need to capture for seasonality.
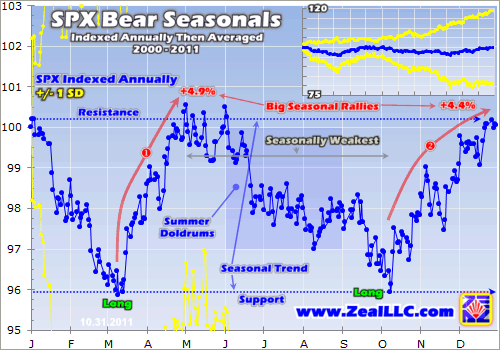
To accomplish this, the SPX’s close on the first trading day of each calendar year is recast at 100. And then all day-to-day percentage changes are indexed off this base. No matter where the SPX is absolutely, high near resistance or low near support in its secular trading range, a 5% rally still takes its index up to 105. Then all these annual indexes are averaged together, and the result is this somewhat-surprising chart.

As I expected in a sideways-grinding secular bear, the SPX’s seasonals were flat. Seasonally on average, the general stock markets are likely to end a calendar year right where they started. But there was far-more volatility within this flatlined seasonality than I expected. Within today’s secular stock bear, there are definite seasonal rallies and slumps. Amazingly, traders can probably use this knowledge!
Between 2000 and 2011, on average the SPX suffered a rough January and February. This tended to drive the stock markets to a major seasonal low by early March. Provocatively, this is near when gold tends to carve a major seasonal low as well. Since Januaries and Februaries in the stock markets over the past decade have been very different depending on whether we happened to be in a cyclical bear or cyclical bull at the time, it’s hard to generalize a reason from this catch-all average.
Regardless, the SPX starts surging in March in its first major seasonal rally of the year. Between early March and early May, the SPX tends to power an impressive 4.9% higher on average. This is actually its biggest seasonal rally of the year! I suspect the psychology of spring is a factor. After a dark cold winter, we all start feeling more optimistic as spring dawns. More daylight and warmer temperatures provide a wonderful psychological boost, and when traders feel good for any reason at all they are more likely to buy stocks.
But once May rolls around, the general stock markets tend to spend that month topping. The old stock-market adage “sell in May and go away” is firmly rooted in historical seasonal tendencies. It has certainly proven to be wise advice within today’s secular stock bear, as after May the SPX tends to sell off sharply in June before drifting even lower into early August. This is the summer doldrums, a time when interest in speculating and investing wanes as many traders’ focuses shift to enjoying the sunny vacation season.
These same summer doldrums weigh on many commodities prices, including gold’s. The summer is the seasonally-weakest time of the year for all kinds of financial assets. Low volume and lack of interest lead to lackluster price action most of the time. So if you have fresh capital you haven’t yet deployed by the dawn of the market summer (Memorial Day), you are probably better off parking in cash until autumn.
Interestingly the stock markets keep drifting lower on average into the market autumn, which starts right after Labor Day. September has tended to be a rough month for the SPX in this secular bear, leading to a second seasonal-support approach in early October. This surprised me, as I’ve long considered September a bullish time for stocks seasonally as traders start refocusing on the markets again after the summer distractions vanish.
But so far in this secular stock bear seasonally, the true bottom is actually a bit farther into autumn in early October. Once again the SPX tends to be down about 4% year-to-date then on average. But instead of plunging even deeper in October as that month’s fearsome reputation portends in many traders’ minds, the stock markets start rocketing higher in their second big seasonal rally. This catapults the SPX 4.4% higher on average by the end of December.
So within the context of today’s secular stock bear, the best times of the year to add new stock positions are at the SPX’s major seasonal lows in early March and early October. The SPX tends to rally 4% to 5% higher over the coming two or three months from those seasonal-support approaches. And some popular sectors including commodities stocks and tech stocks tend to leverage and amplify underlying SPX gains, so their average returns usually double or triple the SPX’s baseline. Such gains are well worth pursuing.
Seasonally the best times of the year to sell stocks and realize profits is in early May and late December right as these big seasonal rallies peak. The May selling point makes perfect sense with the dawn of summer, but the late December one surprises me. Once again it is probably sentiment-related. After enjoying the festiveness and optimism of the holidays, traders face the bleakest months of winter which dampen spirits. Income-cycle factors probably play a major role as well in this early-year slump.
The end of a calendar year is often the first time when many people know for sure just how much surplus income they earned that year. Only then have all that year’s expenses been recorded, and all its income has been earned including any bonuses. This is likely a major factor in December’s strong stock seasonality, surplus capital is put to work. But once that is done, we face a whole new year of great unknowns.
On top of this, many people have to start saving aggressively early in a new year to pay off the past year’s income taxes due. Others have holiday debts to pay down. All this spending pressure, in addition to the psychological ebb of winter, likely contributes to the weak SPX seasonality in January and February. This is contrary to many popular assertions that January tends to be a strong month for the stock markets.
So after resisting building the complex spreadsheet underlying these charts for many years, I’m glad I finally did it. So thanks if you are one of the people asking about this! The early year isn’t as good seasonally as we’ve been led to expect, though the spring rally is awesome. And the autumn rally isn’t likely to start in early September, but a month later in early October. And the summer doldrums are a sentiment wasteland for stocks just like they are for commodities. All this is very valuable knowledge to have!
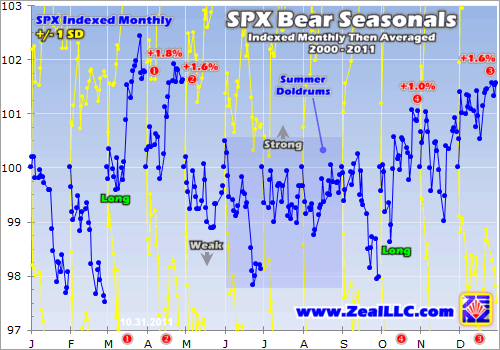
This next chart digs deeper into individual calendar months, indexing them individually throughout this secular stock bear and then averaging them. This offers additional insights into intra-month action that aren’t readily apparent in the annual seasonals. It also clearly highlights the strongest and weakest months of the year seasonally for the SPX, which is certainly good to be aware of.

Seasonally in this secular stock bear, the SPX’s worst months are February, September, January, and June. They all have seen average declines on the order of 2% or so since 2000. Meanwhile the best months of the year seasonally for general stocks are March, April, December, and October. Their average rallies over the past decade of sideways-grinding markets were 1.8%, 1.6%, 1.6%, and 1.0%.
So don’t expect too much from stocks early in a new year, early in the summer, or early in the autumn. Their bear seasonals just aren’t favorable then. But the strong seasonal rallies in the spring and late autumn contain some very impressive months, so the odds are really in your favor then for being long stocks. Despite the overall flatness of this secular bear, definite seasonal tendencies have still emerged.
November is also interesting to consider since it is where we happen to be today. Note that early November is a weak month seasonally, seeing a considerable decline in the SPX on average. But about two-thirds of the way through, the SPX tends to bottom and rally sharply again. This leads into December’s strong seasonal rally. And the data cutoff for this chart is October 31st, so it doesn’t include November 2011. Yet today’s yucky November has mirrored Novembers past. A bullish omen?
Seasonality in general is fascinating, and this stock bear seasonality definitely has tradable tendencies. But realize that seasonality is always relegated to being a secondary driver at best. It is sentiment, the collective greed and fear of traders active in the markets, that is the primary driver of short-term stock-market action. Seasonals are like prevailing winds, either helping or hindering short-term sentiment trends.
If the stock markets are very overbought, meaning the SPX has rallied too far too fast, then they are likely to correct imminently no matter how strong seasonals happen to be. And if the SPX is oversold, it has fallen too far too fast, it is likely to soon rally even in a seasonally-weak time. Seasonals are most valuable to traders when they line up with current sentiment trends, providing a tailwind that strengthens them.
A great analogy is the effect of prevailing winds on an airplane. While its engines are its primary driver, the plane still uses less fuel and gets to its destination quicker if it has a nice tailwind pushing it along. While the plane can still fight a headwind, it is less economical and slower. A stock-market rally happening for sentimental and technical reasons is likely to be bigger and stronger with seasonal tailwinds than headwinds, although it will still rally either way.
Another important thing to keep in mind is secular stock bears are certainly not homogenous like secular commodities bulls. Depending on whether the SPX happens to be in a cyclical bear or cyclical bull, certain seasonal tendencies are likely to be more pronounced. During a cyclical bear, the seasonally-weak months have higher odds of seeing bigger stock-market selloffs. And during a cyclical bull the strong months are more likely to experience larger rallies. Never ignore the critical bull-bear cycles!
At Zeal we’ve been relentlessly studying the stock markets and commodities for this entire secular bear. Taking a contrarian approach of buying fear and selling greed, we’ve enjoyed great success in a tough decade when the general stock markets languished flat. Specializing in commodities stocks, our track record has been outstanding. Since 2001, all 591 stock trades recommended in our subscription newsletters have averaged awesome annualized realized gains of +51%! That’s tough to beat.
Unlike any other arena in the world, superior understanding pays off in spades in the stock markets. You too can share in the profitable fruits of our hard labors. We publish acclaimed weekly and monthly subscription newsletters. In them I draw on our vast experience, knowledge, wisdom, and ongoing research to explain what the markets are doing, why, and how to trade them with specific stock trades as opportunities arise. Subscribe today and become a better speculator and investor!
The bottom line is the stock markets exhibit definite seasonal tendencies, even within this great sideways-grinding secular bear. They tend to rally sharply in spring and late autumn, and then slump in summer and early in a new year. While these seasonals are secondary drivers that can easily be overridden by divergent sentiment and technicals, they are still worth considering before buying or selling stocks.
Overbought stock markets will still correct even in the face of strong seasonals, and oversold ones will still rally even if seasonals are weak. But when overboughtness lines up with weak seasonals or oversoldness with strong seasonals, the resulting move is likely to be larger than it would have been without the seasonal tailwinds. And the latter is true today, setting us up for a major stock-market rally.
Adam Hamilton, CPA
So how can you profit from this information? We publish an acclaimed monthly newsletter, Zeal Intelligence , that details exactly what we are doing in terms of actual stock and options trading based on all the lessons we have learned in our market research. Please consider joining us each month for tactical trading details and more in our premium Zeal Intelligence service at … www.zealllc.com/subscribe.htm
Questions for Adam? I would be more than happy to address them through my private consulting business. Please visit www.zealllc.com/adam.htm for more information.
Thoughts, comments, or flames? Fire away at zelotes@zealllc.com . Due to my staggering and perpetually increasing e-mail load, I regret that I am not able to respond to comments personally. I will read all messages though and really appreciate your feedback!
Copyright 2000 - 2011 Zeal Research ( www.ZealLLC.com )
Zeal_LLC Archive |
© 2005-2022 http://www.MarketOracle.co.uk - The Market Oracle is a FREE Daily Financial Markets Analysis & Forecasting online publication.


