Gold Triple Play – Volatility, Currencies and Europe
Commodities / Gold and Silver 2011 Nov 25, 2011 - 07:40 AM GMTBy: Frank_Holmes
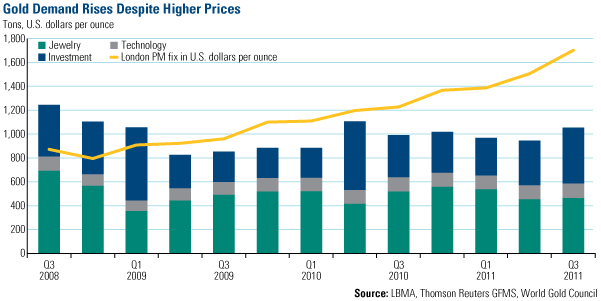
 Resurgent investment lifted global gold demand 6 percent from the previous year to just over 1,000 tons during the third quarter of 2011, according to the latest Gold Demand Trends Report from the World Gold Council (WGC).* The potent cocktail of inflationary pressures in the emerging world and the European sovereign debt fiasco left investors searching for a safe haven—they looked for it in gold.
In an uncertain era where many asset values are declining, gold has thrived. Gold prices averaged $1,700 an ounce during the third quarter of 2011, 39 percent higher than the same time last year and 13 percent above the previous quarter, according to the WGC.
In total, investment demand increased 33 percent on a year-over-year basis to reach the third-highest quarter of investment demand on record, says the WGC. The increase was broad in scope. Investment in gold bars and coins jumped 29 percent year-over-year while holdings in gold ETFs reached an all-time high.

All global markets other than India, Japan and the U.S. experienced gains in investment demand; many of them (except Thailand and Saudi Arabia) saw double-digit increases.
While investment demand thrived during the third quarter, jewelry demand fell victim to the quarter’s economic fragility and price volatility—falling 10 percent on a year-over-year basis. Only four markets—China, Hong Kong, Japan and Russia—saw jewelry demand increase.
The WGC says a shift toward high-growth economies is “undeniably conspicuous in the gold market.” Nowhere in the world is this more evident than in China, where consumer thirst for gold appears unquenchable. China’s total demand, around 612 tons year-to-date, has already eclipsed that of 2010. In addition to domestically consuming every speck of gold mined in China, it’s estimated that the country’s gold imports could reach 400 tons in 2011. That’s roughly equal to the combined tonnage of gold demand for the Middle East, Turkey and Indonesia in 2010—and that’s just imports.
Consumer demand for gold in China increased 13 percent (year-over-year) during the third quarter as the country continues to close the gap on India. Chinese jewelry demand, also up 13 percent, eclipsed India for only the fourth time since January 2003. Combined, the two Asian giants account for over 50 percent of global jewelry demand.
The WGC says, “China’s increase in demand is being fueled by rising income levels, a by-product of China’s rapid economic growth.” This growth has given birth to more than 100 million gold bugs in China’s rural areas. China’s smaller third- and fourth-tier cities were responsible for the bulk of the increase in jewelry demand, the WGC says. In addition, the Gold Accumulation Plan (GAP), a joint effort from the Industrial & Commercial Bank of China (ICBC) and the WGC which allows investors to purchase gold in small increments, reached 2 million accounts in September. The WGC says GAP sales have already exceeded 19 tons so far this year.
Things weren’t quite as rosy for demand in the world’s second-largest jewelry market. Indian jewelry demand took a 26 percent hit as volatility in the rupee shook investor confidence. The rupee decreased 9 percent against the U.S. dollar during the third quarter, more than double the currency’s average quarterly move over the past five years.
Historically, Indian jewelry demand bottoms in July-August, before picking up heading into the Shradh period of the Hindu calendar. That didn’t happen this year because Indian consumers were discouraged by high and volatile prices. The WGC says:
“Consumer confidence in India has been knocked by the persistence of high domestic inflation rates. Inflation of almost 10 percent, as measured by the Wholesale Price Index (WPI), adversely affected jewelry demand, through its impact on both disposable income levels and general consumer sentiment.”
Currency Effect on Gold Prices
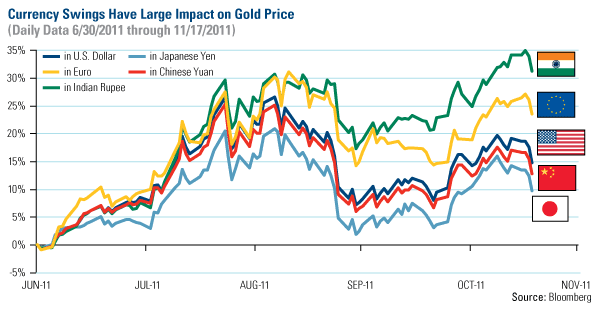
The weaknesses of the rupee against the U.S. dollar also negatively affected India’s demand. This chart illustrates the dramatic effect currency fluctuations can have on gold prices.

The gold price in Indian rupees has appreciated over 31 percent since June 30, more than three times the price appreciation denominated in Japanese yen. This means that a consumer looking to buy gold in Japan would have three times the purchasing power to buy gold at their local dealer than an Indian counterpart.
The gold price in yen terms has lagged due to the currency’s strong appreciation against other global currencies. It’s a similar story for the U.S. dollar and Chinese yuan (pegged to the U.S. dollar), which investors have favored since fleeing the euro.
Gold’s Volatility
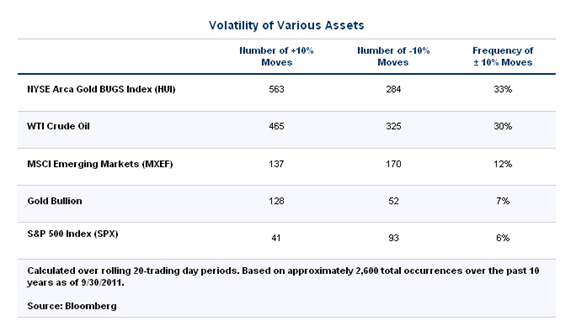
Chaos in the currency markets amplified gold’s volatility to roughly twice historical levels during the third quarter, the WGC says. Our research also shows that gold’s recent roller-coaster ride is an anomaly. We sorted through 10 years of data to capture all of the 10 percent (plus or minus) moves selected assets have had over a one-month period. The results show gold experiences plus/minus 10 percent moves 7 percent of the time; about the same as the S&P 500 Index. In comparison, crude oil sees moves of this magnitude 30 percent of the time.

Gold equities have been more volatile than gold bullion. The NYSE Arca Gold Bugs Index (HUI) experienced these swings 33 percent of the time. In a market with gold prices trending upward, this beta provides a potential boost for miners. However, this can also have a negative effect during volatile markets as investors overreact to downside swings.
Gold Outlook
“Gold demand faces headwinds in the near term because of the strength of the U.S. dollar,” Marcus Grubb, Managing Director of Investment for the WGC said on a conference call Thursday. “I still think the macro situation is very favorable to gold because we still don’t have a lender of last resort in the eurozone.”
Speaking of the eurozone, Nigel Farage—leader of the United Kingdom’s Independence Party—spoke some much-needed harsh words to the European Council this week. Farage is one of the U.K.’s most powerful conservative officials and is an unabashed Eurosceptic, meaning he does not ideologically believe in the idea of the European Union. I originally saw the video posted on Zero Hedge* but it has since gone viral.
Farage lambasted the group saying, “The Euro is a failure and who is actually responsible, who is in charge out of you lot? Well of course the answer is none of you because none of you have been elected. None of you actually have any democratic legitimacy for the roles that you currently hold with this crisis.” “You should all be held accountable for what you’ve done,” Farage continued later. “You should all be fired.”

Click here to watch the video.
I think Farage echoes the sentiments of many, who are exhausted, enraged and exasperated by the technocrat circus in Europe. Europe’s carousel of fiscal calamity will certainly keep spinning in the near term and will likely continue to be covered heavily by the media. This will continue to drive the Fear Trade, while China and the Far East power the Love Trade by feasting on gold.
That's a distant projection but it certainly illustrates why you should consider investing a portion of your wealth in oil.
For more updates on global investing from Frank and the rest of the U.S. Global Investors team, follow us on Twitter at www.twitter.com/USFunds or like us on Facebook at www.facebook.com/USFunds. You can also watch exclusive videos on what our research overseas has turned up on our YouTube channel at www.youtube.com/USFunds.
By Frank Holmes
CEO and Chief Investment Officer
U.S. Global Investors
U.S. Global Investors, Inc. is an investment management firm specializing in gold, natural resources, emerging markets and global infrastructure opportunities around the world. The company, headquartered in San Antonio, Texas, manages 13 no-load mutual funds in the U.S. Global Investors fund family, as well as funds for international clients.
All opinions expressed and data provided are subject to change without notice. Some of these opinions may not be appropriate to every investor.
Standard deviation is a measure of the dispersion of a set of data from its mean. The more spread apart the data, the higher the deviation. Standard deviation is also known as historical volatility. All opinions expressed and data provided are subject to change without notice. Some of these opinions may not be appropriate to every investor. The S&P 500 Stock Index is a widely recognized capitalization-weighted index of 500 common stock prices in U.S. companies. The NYSE Arca Gold BUGS (Basket of Unhedged Gold Stocks) Index (HUI) is a modified equal dollar weighted index of companies involved in gold mining. The HUI Index was designed to provide significant exposure to near term movements in gold prices by including companies that do not hedge their gold production beyond 1.5 years. The MSCI Emerging Markets Index is a free float-adjusted market capitalization index that is designed to measure equity market performance in the global emerging markets. The U.S. Trade Weighted Dollar Index provides a general indication of the international value of the U.S. dollar.
Frank Holmes Archive |
© 2005-2022 http://www.MarketOracle.co.uk - The Market Oracle is a FREE Daily Financial Markets Analysis & Forecasting online publication.


