Stock Market Thanksgiving Update
Stock-Markets / Stock Markets 2011 Nov 24, 2011 - 01:17 PM GMTBy: Tony_Caldaro
 SHORT TERM: markets try to rebound from oversold levels, DOW (YM) -19
Overnight the Asian markets were mixed. Europe opened higher and closed -0.20%. US index futures were higher, then lower overnight: SPX (ES) -0.75 and NDX (NQ) -3.75. The US market is closed for the holiday and will reopen tomorrow. Bonds lost 15 ticks, Crude gained 70 cents, Gold slipped $1.00, and the USD was lower.
After a nasty beginning to this holiday week: SPX/DOW -4.50% and NDX/NAZ -4.15%, we took a look at the nearly 20 world indices we currently track. Most appear to be in downtrends, along with the US, from the late October highs. Six have already confirmed downtrends: India’s BSE, France’s CAC, Spain’s IBEX, Italy’s MIB, Japan’s NIKK, and Switzerland’s SMI. And, two have already broken to new 2011 lows: India and Japan. India and Japan are both having currency problems verses the USD.
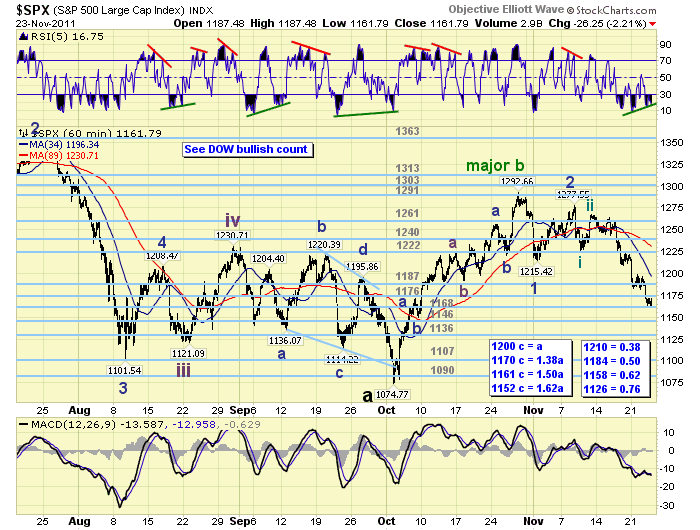
In the US we have been tracking two counts medium/short term. One posted on the SPX charts and the other on the DOW charts. After placing a low at SPX 1075 in early October the market soared 20.3% to SPX 1293 in just 18 trading days. This uptrend unfolded so quicky that it was difficult to determine if it was implusive or corrective. But it did look impulsive. Since that high the market has declined in several noticeable waves: SPX 1215, 1278, 1227, 1267 and the current decline to 1162. In a bearish scenario, posted on the SPX charts, this is counted as a Minor 1-2, then a Minute i-ii-iii of Minor 3.

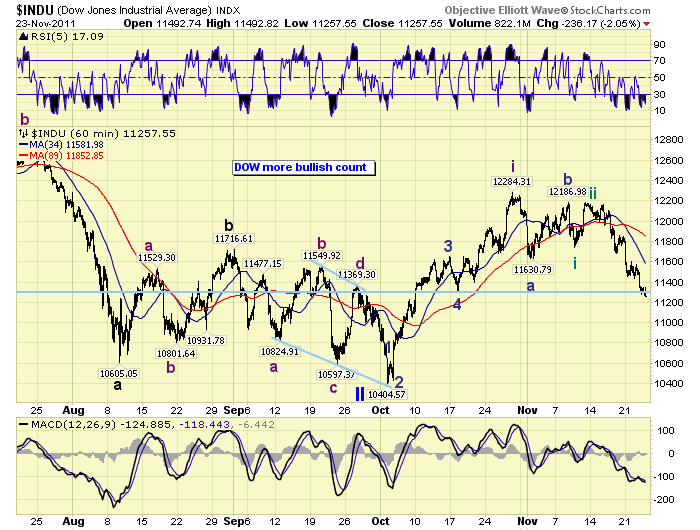
Under a more bullish scenario, posted on the DOW charts, this is counted as a Minor a-b, then a Minute i-ii-iii of Minor c.

Applying either count, there clearly appears to be more downside activity ahead short term. As this downtrend unfolds, or when it ends, we’ll have a better idea of which of these counts is the markets count. The 10% decline from SPX 1293 to 1162 keeps us in the neutral camp long term, but now with a slightly bearish bias. Happy holiday! And, best to your trading.
MEDIUM TERM: downtrend apparently unfolding
LONG TERM: neutral
CHARTS: http://stockcharts.com/...
http://caldaroew.spaces.live.com
After about 40 years of investing in the markets one learns that the markets are constantly changing, not only in price, but in what drives the markets. In the 1960s, the Nifty Fifty were the leaders of the stock market. In the 1970s, stock selection using Technical Analysis was important, as the market stayed with a trading range for the entire decade. In the 1980s, the market finally broke out of it doldrums, as the DOW broke through 1100 in 1982, and launched the greatest bull market on record.
Sharing is an important aspect of a life. Over 100 people have joined our group, from all walks of life, covering twenty three countries across the globe. It's been the most fun I have ever had in the market. Sharing uncommon knowledge, with investors. In hope of aiding them in finding their financial independence.
Copyright © 2011 Tony Caldaro - All Rights Reserved Disclaimer: The above is a matter of opinion provided for general information purposes only and is not intended as investment advice. Information and analysis above are derived from sources and utilising methods believed to be reliable, but we cannot accept responsibility for any losses you may incur as a result of this analysis. Individuals should consult with their personal financial advisors.
© 2005-2022 http://www.MarketOracle.co.uk - The Market Oracle is a FREE Daily Financial Markets Analysis & Forecasting online publication.


